Plot Wavescans!
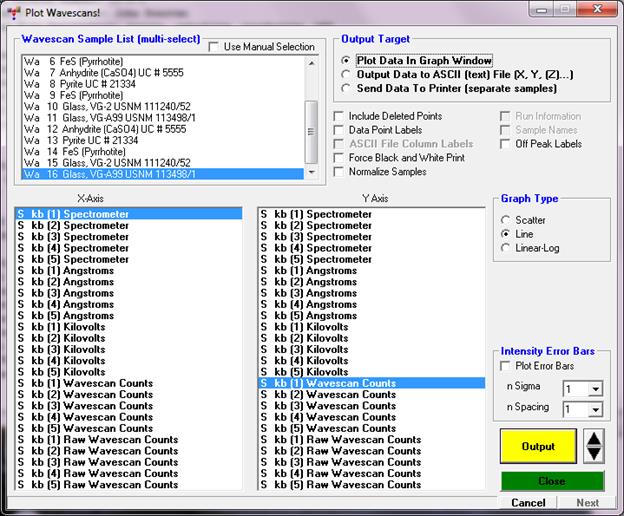
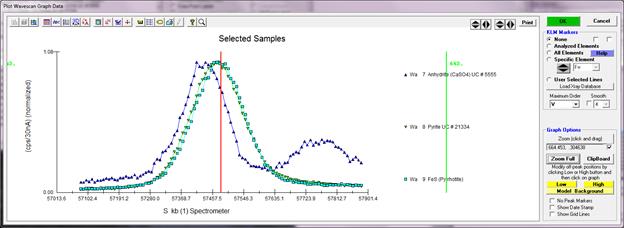
The Plot Wavescans! modeless windows provides graphical plotting of spectrometer wavelength scans in Probe for EPMA. Standard, unknown and wavescan sample data may be displayed from the Output | Plot Standards and Unknowns menu. Wavescan samples can display KLM markers from the NIST database based on the analyzed elements in the range, all elements in the range or a specific element in the range.
Note that one can configure Probe for EPMA to specify elements that should never show up in the KLM markers. The default forbidden elements are Tc, Pm, Po, At, Rn, Fr, Ra, and Ac. See the [Plot] section of the PROBEWIN.INI file for instructions on adding or deleting elements from this list. Note that x-ray lines do not exist for H and He so they are automatically excluded from the KLM database.
Background types (linear, high only, low only, average, etc.) can be modeled based on existing wavescan samples, evaluated and updated for both standard and unknown samples using the Model Background dialog.
 Output Target