Graph Data
The Graph Data window is used in two modes. The first to plot x-ray intensity or compositional data from standard and unknown samples, and the second to plot x-ray intensity and spectrometer position data for wavescan samples. Multiple Y data is automatically plotted and listed in a color coded legend if specified in the Plot! window.
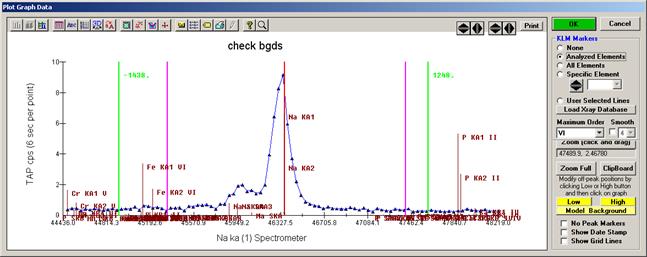
Note that for wavescan plots if the on and off-peak positions are plotted, the markers for the on-peak position is cyan, the current off-peaks are green and the original off-peaks are magenta.
Digitized x and y position data from polygon boundary acquisitions may also be plotted in this window if this data exists in the current probe database file.
Numerous plot properties may be modified using the tool bar buttons at the top of the graph. A print button has also been added to facilitate printing but other print and output options can be accessed using the System tool bar button (printer icon).