Calculate Secondary Fluorescence
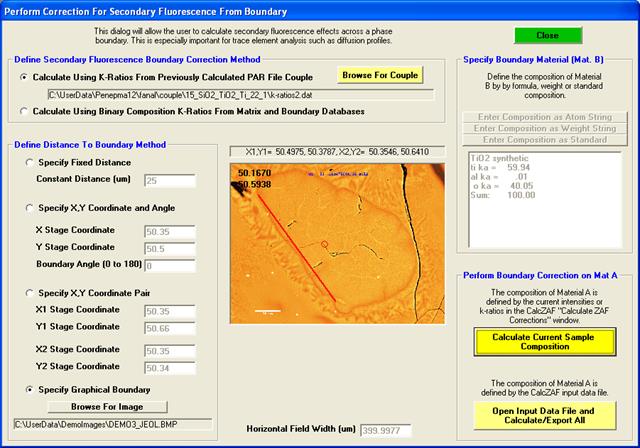
This menu will allow the user to specify secondary fluorescence effects due to the presence of nearby phases using a method developed by Xavier Llovet and Cesc Salvat. To perform the calculation the secondary fluorescence effects one must know the composition of the phase itself, the composition of the nearby phase and the distance to the nearby phase. The volume of the phase itself is assumed to be zero and at the surface for the calculation purposes.
To facilitate the secondary boundary fluorescence calculation please note that the Output | Save CalcZAF Output Format menu can be used to output Probe for EPMA intensity data for a sample for this boundary correction. The stage coordinates are automatically included to accurately calculate the distance to the specified boundary (see below).

First define the method for the boundary correction. Currently only the PAR file calculation option has been implemented. The MAT and PAR files can be calculated in Standard based on an existing standard composition or specified formula. Be sure to specify the density for each material. Also note that any analyzed sample in Probe for EPMA can be exported as a MAT file from the Analyze! Window Create Material File button.
Note that the beam incident, boundary and standard material must be calculated as PAR files in Standard.exe prior to this procedure. The final intensity extraction using Fanal.exe (from Standard.exe) must be performed using the same beam energy, element and x-ray line as the data was acquired with. The PAR file calculations in Standard.exe take approximately 10 hours each and are saved as a “k-ratios2.dat” file which must be browsed for in this dialog.
Second, define the boundary distance calculation method. One can define a specified fixed distance, a single stage coordinate and an angle (0 = vertical and 90 = horizontal), two stage coordinates or a graphical method based on a stage calibrated BMP file exported from Probe for EPMA.
Next load a sample from the main File menu and process each data point separately or open the input file from the secondary fluorescence window here and process all the data points. The position of each data point will be displayed on the image area.