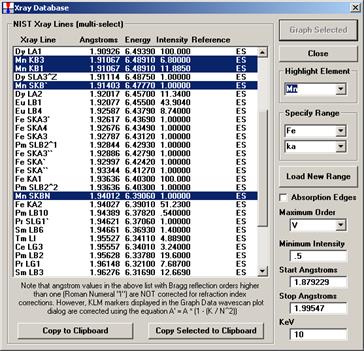
Load X-ray Database
Allow the user to see a list of all files in the graph range. If the User Selected Lines option is clicked, the users can select specific lines for graphing.

To change the range enter the start and stop (ending) angstroms limits and click the Load New Range button. The keV parameter will limit the appearance of higher order lines that cannot be excited below the specified voltage. The Graph Selected button is only active if the User Selected Lines option is selected in the Graph dialog. The reference indicates the source. Specifically, ES is Eric Steele tabulated the first order lines, the higher order lines were calculated by JD (John Donovan).
Note that angstrom values in the x-ray database list with Bragg reflection orders higher than one (Roman Numeral "I") are NOT corrected for refraction index corrections. However, KLM markers displayed in the Graph Data wavescan plot dialog are corrected using the equation A' = A * (1 - (K / N^2)) where A is the uncorrected angstrom position, K is the refractive index from the CRYSTALS.DAT file and N is the Bragg reflection order. From the expression sinθ = N * λ/(2d * (1.0 - K/N^2)).
The Maximum Order determines the maximum Bragg order that will be displayed that is less than the current operating voltage (not that some emission lines near the operating voltage that are displayed will not be generated since the actual energy required is always greater than the edge energy of the line in question). The default x-ray database XRAY.MDB displays up to 10th order lines. Additional x-ray databases are available with up to 20th order lines.
Note that one can configure Probe for EPMA to specify elements that should never show up in the KLM markers. The default forbidden elements are Tc, Pm, Po, At, Rn, Fr, Ra, and Ac. See the [Plot] section of the PROBEWIN.INI file for instructions on adding or deleting elements from this list. Note that x-ray lines do not exist for H and He so they are automatically excluded from the KLM database.