Blank Correction
From EPMA Xtreme Probe
Blank Correction
The blank correction can be used to ensure absolute accuracy when measuring trace element levels close to zero provided a suitable sample exists that is similar to the unknown matrix but contain none of the measured element or a known trace level of the measured element.
Simply acquire an unknown sample on the blank calibration sample, for example when measuring Ti in quartz, one could measure Ti in a synthetic quartz that contains no Ti. From the Standard Assignment dialog, the user simply selects the measured blank calibration sample (using the same conditions if possible) and sets the blank level to zero (the default) in this case and the program will automatically apply the blank correction when the analysis is performed.
The correction is performed in the matrix iteration by calculating the corresponding intensity based on the measured blank offset and this data is used to adjust the background correction. In this way the P/B statistics and k-ratios are always self-consistent.
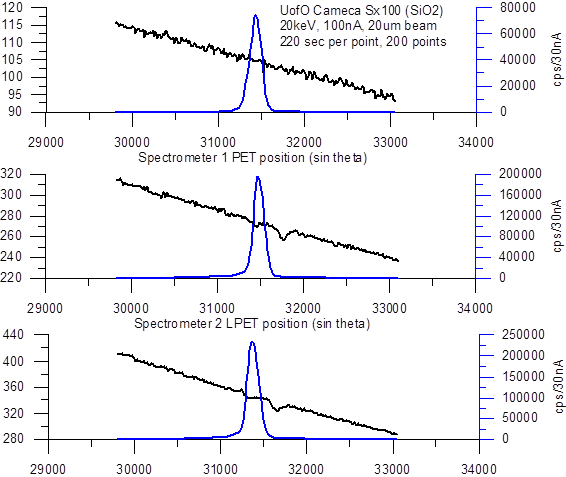
This correction is necessary because of analyzing crystal artifacts which produce systematic errors in the measurement of peak intensities as seen in the following graphs which contain scans on both SiO2 and TiO2 at the Ti Ka peak position. Note that spectrometers 2 and 3 show “holes” in the background which will affect the accuracy of trace element analysis. The blank correction will correct for this systematic error.
The following analysis is of a standard synthetic quartz with a Ti concentration of zero. The blank correction has been applied to itself to demonstrate the validity of the correction by calculating the intensity offset from the measured concentrations and calculating the resulting concentrations (which should be zero). Note the fact that the P/B values are very close to unity.
Un 4 SiO2 synthetic
TakeOff = 40.0 KiloVolt = 20.0 Beam Current = 100. Beam Size = 20
(Magnification (analytical) = 8000), Beam Mode = Analog Spot
(Magnification (default) = 600, Magnification (imaging) = 100)
Number of Data Lines: 12 Number of 'Good' Data Lines: 12
First/Last Date-Time: 05/31/2007 04:41:29 PM to 05/31/2007 06:12:21 PM
WARNING- Using Blank Trace Correction
WARNING- Using Alternating On and Off Peak Acquisition
WARNING- Using Polynomial Alpha-Factor Matrix Corrections
Average Total Oxygen: 53.257 Average Total Weight%: 100.000
Average Calculated Oxygen: 53.257 Average Atomic Number: 10.805
Average Excess Oxygen: .000 Average Atomic Weight: 20.029
Average BET Iteration: 2.00 Average Quant Iterate: 3.00
Oxygen Calculated by Cation Stoichiometry and Included in the Matrix Correction
WARNING- Duplicate analyzed elements are present in the sample matrix!!
Use Aggregate Intensity option or Disable Quant feature for accurate matrix correction.
Results in Elemental Weight Percents
ELEM: Ti Ti Ti Ti Ti Si O
TYPE: ANAL ANAL ANAL ANAL ANAL SPEC CALC
BGDS: LIN LIN LIN LIN LIN
TIME: 200.00 200.00 200.00 200.00 200.00
ELEM: Ti Ti Ti Ti Ti Si O SUM
XRAY: (ka) (ka) (ka) (ka) (ka) () ()
421 .00007 .00028 -.00001 .00074 -.00022 46.7430 53.2576 100.001
422 -.00011 -.00009 .00010 -.00039 .00001 46.7430 53.2567 99.9992
423 .00006 .00002 .00019 .00011 .00055 46.7430 53.2576 100.002
424 .00033 -.00045 -.00007 -.00106 -.00013 46.7430 53.2561 99.9977
425 .00019 .00021 -.00013 .00078 -.00004 46.7430 53.2577 100.002
426 .00000 .00013 -.00008 .00015 -.00008 46.7430 53.2571 100.000
427 -.00023 .00029 .00005 .00076 -.00061 46.7430 53.2572 100.000
428 -.00034 -.00002 .00015 -.00047 -.00015 46.7430 53.2564 99.9986
429 -.00023 -.00003 -.00001 -.00009 .00022 46.7430 53.2569 99.9998
430 -.00010 .00002 -.00011 -.00003 .00045 46.7430 53.2572 100.000
431 .00016 -.00007 -.00009 -.00035 .00037 46.7430 53.2570 100.000
432 .00019 -.00029 .00002 -.00016 -.00037 46.7430 53.2566 99.9990
AVER: .00000 .00000 .00000 .00000 .00000 46.7430 53.2570 100.000 <- blank corrected
SDEV: .00020 .00022 .00011 .00056 .00034 .00000 .00049
SERR: .00006 .00006 .00003 .00016 .00010 .00000 .00014
%RSD: ---- ---- ---- ---- ---- .0 .0
STDS: 22 22 22 22 22 0 0
STBE: 3.4651 3.4651 3.4651 3.4651 3.4651 .0000 .0000
STCT: 57993.6 22162.3 69644.5 3194.7 20247.7 .0 .0
UNBE: 1.1935 1.1935 1.1935 1.1935 1.1935 .0000 .0000
UNCT: .0 .0 .0 .0 .0 .0 .0 <- blank corrected
UNBG: 81.1 30.8 105.1 2.4 27.7 .0 .0
KRAW: .00000 .00000 .00000 .00000 .00000 .00000 .00000
PKBG: 1.00002 1.00004 1.00000 1.00079 1.00007 .00000 .00000 <- blank corrected
BLNK#: 4 4 4 4 4 ---- ---- <- blank assignment
BLNKL: .000000 .000000 .000000 .000000 .000000 ---- ---- <- blank level
BLNKV: -.00043 -.00009 -.00053 .000039 .000704 ---- ---- <- blank measurement
The calculation is performed by calculating the intensity correction for the unknown sample from the quantitative measurement of the blank sample and subtracting that intensity from the measured intensity in the matrix iteration using the following expression:
![]()
Where: [ZAF]S is the ZAF correction for the primary standard
[ZAF]U is the ZAF correction for the unknown (iterated)
IS is the measured standard intensity in the primary standard
CP is the measured concentration of the element in the blank sample
CL is the blank level concentration of the element in the blank sample (usually zero)
CS is the concentration of the element in the primary standard