5 5 Interactive Hot Charts
From LANSA Client
5.5 Interactive Hot Charts
The interactive Hot Chart facility allows you to immediately locate from your chart the section of the results that makes up a segment of the chart.
To do this, simply click with your left mouse button on any portion of a chart and the associated row of data in your results window will be instantly highlighted.
This means, for example, that if you notice that there is an abnormality in your chart, you will be able to immediately pinpoint that section of data in your results. If you are charting a Linked Query, you can then 'drill down' further into your data to determine the cause of the abnormality. This is a powerful feature of LANSA Client.
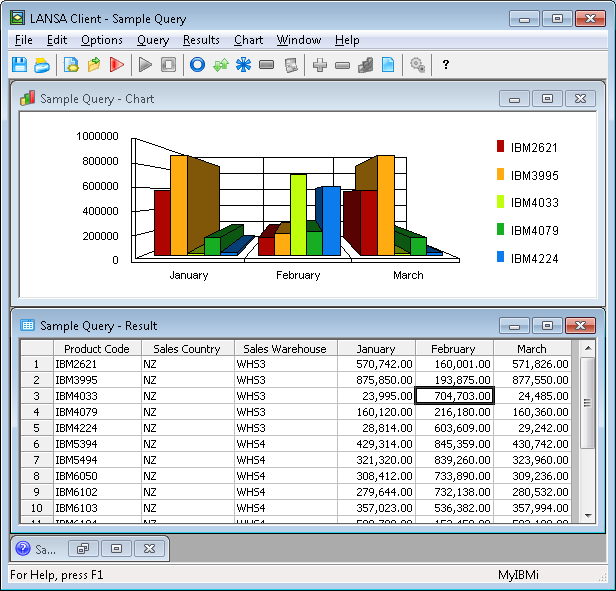
The interactive Hot Chart facility is more effective if you use the Tile command from the Windows menu to display the Results and Chart windows at the same time.
Note: Once a row of data is highlighted, do not select that data again in the results window as this will cause the chart to be recreated using just the selected portion of data.
To turn this facility off, click on the Hot Chart box in the Chart Options.
Further Information