5.1 Create a New Chart
You create the first chart for a query from the Results window. To do this:
- First select the data to be charted, by:
- pressing your left mouse button when the mouse pointer is over the first "cell" of data to be charted
- dragging the pointer to the last "cell" you want to chart while keeping the mouse button depressed
- releasing the mouse button.
- Select the command from the menu on the menu bar.
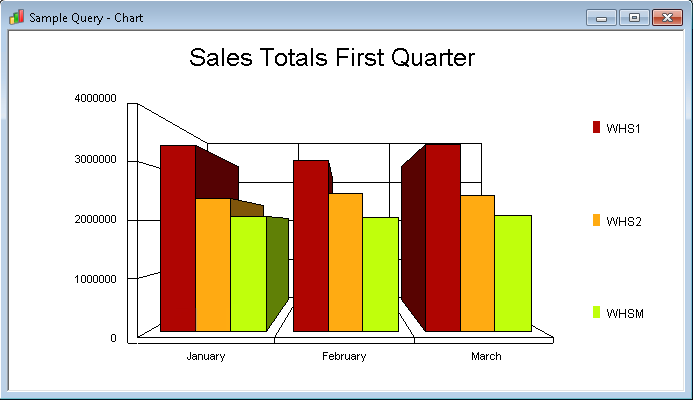
This will instantly display a chart of the selected data. The type of chart and the options such as color range, chart name's font and so on, will be displayed in whatever default has been specified in the . If there are no defaults specified, then your data will be charted using a vertical bar chart.
Tip
If you want to chart only the totals of your query, just hide the data rows using the Collapse Group command from the Results menu, then you can select just the summary rows you want to include in a chart.
You can now:
- choose another chart type as described in 5.2 Select the Chart Type.
- change the look of the chart as described in 5.3 Customize a Chart.
- insert the chart into another document as described in 5.7 Copy a Chart into Another Application.
- save the chart, as described in 5.9 Save a Chart.
- open another Chart window as described in 5.4 Multiple Chart Windows .
- select another portion of your Results to chart.
Further Information