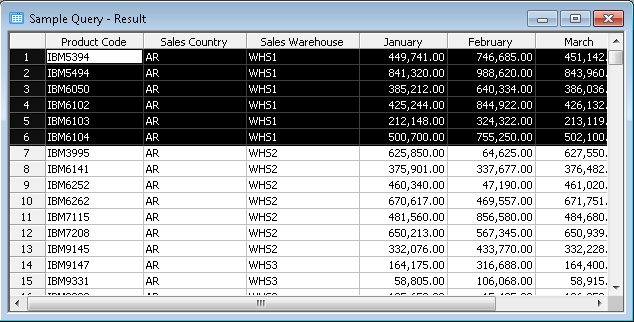
Step 5. Chart Results
Before you can create this chart, your Result window must have the focus and all the details must be displayed.
1. If the window does not have the focus, click on its title bar.
2. If the details are not all displayed, select the command.
Now you will chart the sales figures for WHSM (Sales Warehouse M) in Argentina (AR).
3. Select all Sales Warehouse M data by clicking on the row number of each WHSM row while holding down the key or alternatively, click and drag the cursor over the WHSM rows.
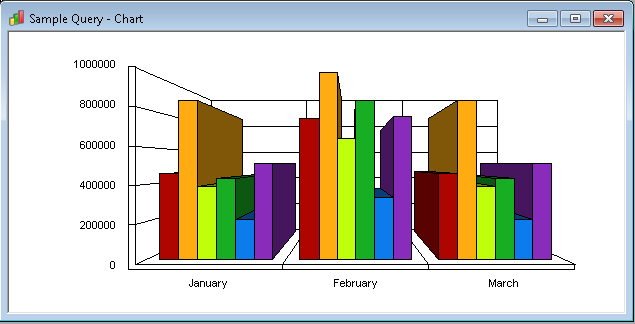
4. When all the cells you require have been highlighted, select the menu and choose the command. Alternatively, you could select the  icon on the Tool Bar.
A Chart window is displayed showing the rows you selected as a 3-dimensional Bar Chart. This is LANSA Client's default chart type.
5. Change the . Select the menu and choose a different chart type from the list. For example, select the Line command.
Notice that the Chart window instantly displays the same data in a line chart.
Note: Pie charts are not suitable to use when you have selected more than one column to chart.
6. Now go to Step 6. Customize the Chart.