Step 7. Use the Hot Chart Facility
LANSA Client's Hot Charting facility allows you to instantly find the actual data in the Results window that makes up any portion of a chart.
To use the Hot Charting facility, you need to display both the Results and Chart windows from the preceding steps. If you no longer have your chart, chart the results again as described in .
1. Minimize the Query Window.
2. Select the Tile command from the Windows menu to display your windows side by side.
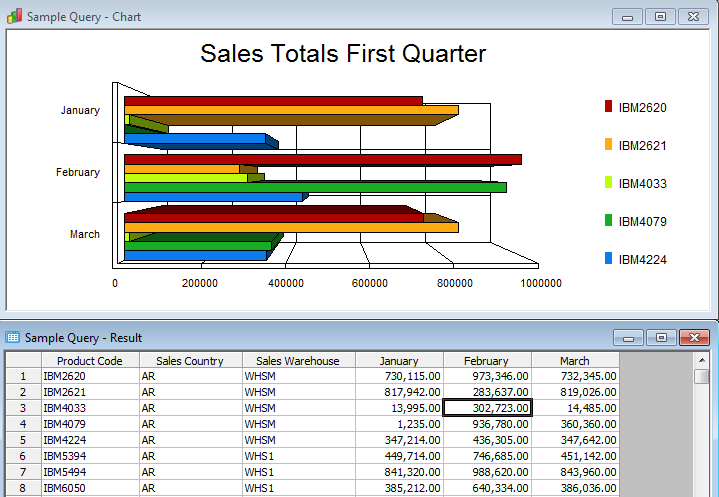
Now you are ready to Hot Chart. Let's say that you want to look at the actual figures that make up the portion of your chart for Product IBM4033 for the month of February.
3. To do this, click on the February bar of Product IBM4033.
Did you see that the corresponding row of data was immediately highlighted in the Results window?
4. Try selecting another portion of your chart to interrogate.
5. When you have finished, close the Chart window.
6. Keep your Results window open for the next tutorial, LCL004 - Edit Data.