4.6 Chart Results
It is easy to chart the results of your query. All you need to do is:
1.Select some or all of your data in the Results window.
2.Select the menu and choose the command or use the  chart icon on the toolbar.
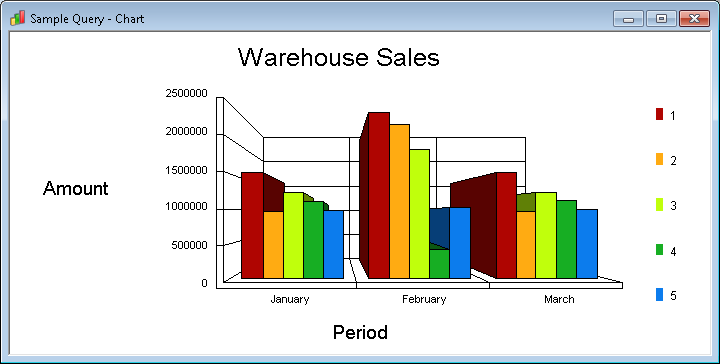
A new Chart window will be displayed with the selected data already charted.
You can re-chart another part of your Results without re-running the query by simply re-selecting a new region of data in the Results window.
Note that only numeric data can be charted. If you select alphanumeric data, it will be ignored.
You can simultaneously chart the same data in up to 4 different chart windows. Each window can display a different type of chart. To open a new Chart window, select the New Window command while you are focused on a Chart window. Use the Tile command in the Window menu to see all your charts at once.
How to customize a chart is described in detail in Creating Charts.
Tip
The data you select for a chart must be contiguous. This means that if you wanted to chart columns 1 and 3, your selection of data would automatically include column 2. To temporarily bypass column 2, simply convert it to "Do not Display" by turning off the tick in the Display field in Results box, in the Sort Options dialog box. When you return to the Results window your original column 3 data will be displayed next to column 1. There is no need to re-run your query.
Further Information