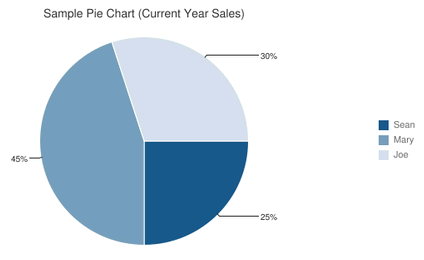
8.2.4 Google Pie Chart (std_gpie_chart)
Pie charts are good to visualize part-to-whole comparisons, like market share for products, sales per product line, etc.
You can create simple or 3D pie charts for single data series. You can use concentric pie charts to visualize multiple data series with each data series showing as a concentric ring.
