8 2 3 Google Line Chart std_gline_chart
From LANSA WAM
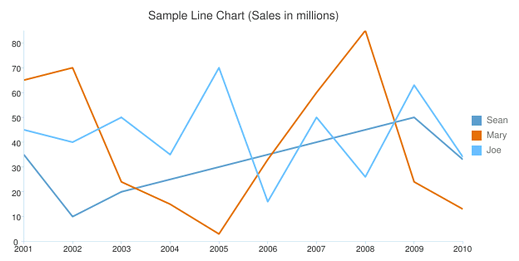
8.2.3 Google Line Chart (std_gline_chart)
Line charts visualize data points joined together by a line.
You can line charts in which your data values represent the points along the range axis distributed at even intervals in the horizontal axis or you provide pairs of data series representing the x,y pairs.
Line charts are good for visualizing trends in a large number of discrete data points.