Graphical Join
From Alchemex 7.1
Home > Connector > Data Containers > Adding a Graphical Join Container
Adding a Graphical Join Container
Sage Intelligence Reporting supports the use of a Graphical Join as the source for Data Containers.
Method
- In the Connector add a new Container to your Connection.
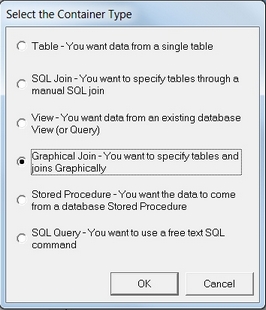
- When the Select the Container Type window appears, select Graphical Join.
- Click OK.
- Enter a descriptive name for the container.
- Click OK to complete adding the container.
- Select the newly created container and in the properties window, click Graphical Join tool.
- Select the tables that you wish to have participate in this graphical join. Join the tables by dragging primary fields in one table onto the secondary fields in the next table.
- Once you have added the tables and joins that you require click Apply.
- Right-click on the new Container and select Add Expressions. When prompted for the expression type to add, select Data Fields.
- The list of fields that the view holds will appear. Select those fields which you would like to be available for reporting on and click OK.
The Container is ready to be used in reports.