Home > Report Designer > Excel Workbook > BI Tools Tab > What If Analyzer
What If Analyzer
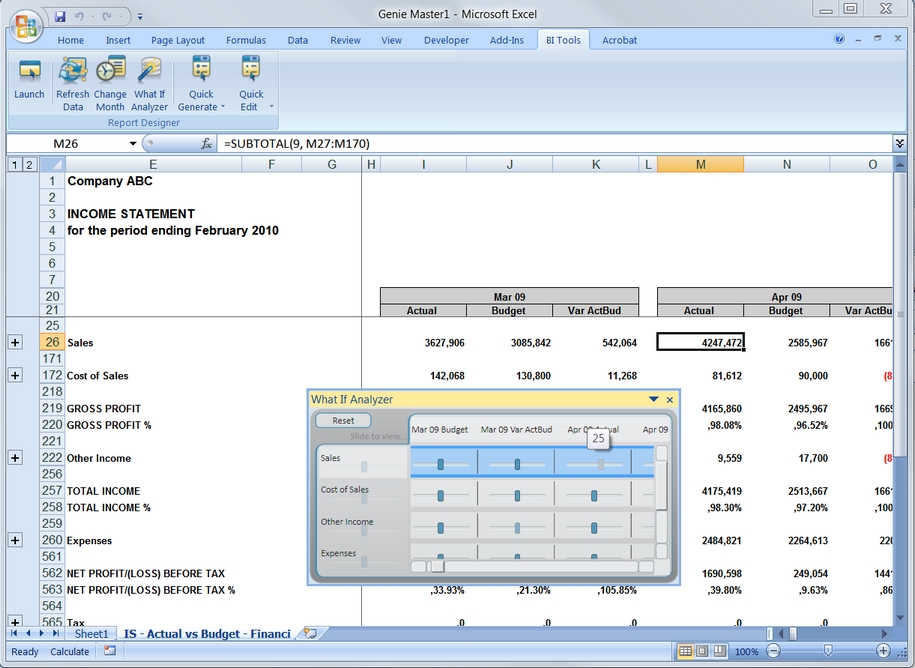
When you have your report open in Microsoft Excel you may like to use the What If Analyzer. The What If Analyzer allows you to dynamically change figures in your spreadsheet and thus assist you when forecasting/ budgeting or creating projections.
You can open the What If Analyzer from the BI Tools Tab or from the wizard once the report is generated.

In the following example, the What If Analyzer is used to forecast a 25% increase in Sales for a particular month. As you drag the slider up or down the % will increase or decrease.
You can select individual columns/ rows or you can adjust an entire row. For example instead of only increasing a months sales by 25%, you could go to the Sales Row and increase the entire row by 25%.
