Add_a_Graphical_Join_Data_Container
From Alchemex 7.1
Home > Tutorials > Connector Tutorial > Add a Data Container > Add a Graphical Join Data Container
Add a Graphical Join Data Container
Overview
From the sample data viewed in the previous exercise, you will notice that the DocumentHeader table is unable to display the Customer name, only the Custsupp ID. We need the customer name for the Microsoft Excel report.
This exercise takes you through the process of creating a container that joins two tables together. This enables you to access all the data in both tables. We will use the Graphical Join tool to do this. Use the help topics: Joining Tables to assist you with this task.
Exercise 1: Add a data container using the graphical join tool
- Create a new graphical join data container named Customer Documents
using the following details:
- Data Connection: Sage Intelligence Reporting Tutorial
- Container Name: Customer Documents
- Tables: DocumentHeader and Customers
- Join Key: CustSuppID(DocumentHeader)and the ID (Customers)
- Join Type: Inner Join
- Check this data container is returning data by sampling the data.
Step by Step Solution:
- Right-click on the Sage Intelligence Reporting Tutorial Connection and select Add data containers. The Select the Container Type dialog box is displayed.
- Select the Graphical Join option then click OK.
- Enter Customer Documents as the name of the container and click OK.
- Select the Customer Documents container.
- In the property window click the Graphical Join button.
- From the Choose Tables dialog box select the DocumentHeader and Customers tables and click OK. The tables appear in the Graphical Join Tool window.
Drag the CustSuppID field from the DocumentHeader table to Customer table and drop it on the ID field. A graphical join line appears as shown in the figure below.
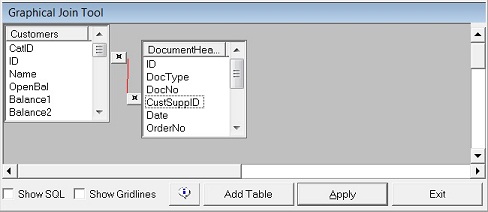
- Click the Apply button. The Graphical Join Tool window closes and the SQL syntax appears in the Join SQL field.