Step 2 Call Your Function in Debug Mode
From LANSA Web Functions
Step 2. Call Your Function in Debug Mode
Before you start this step, make sure that the 5250 device is displaying a user login screen.
1. Using the browser, execute your process iiiPRO03 and function iiiFN07 by entering the URL for the LANSA function, and include the following:
+BDEBUG+devicewhere device is the name you recorded in Step 1
For example: the URL might look something like this:
http://siteaddress/cgi-bin/LANSAWEB?PROCFUN+iiiPROC03+iiiFN07+DEM+BDEBUG+QPADEV0001
2. Switch to the 5250 display you have nominated. You will see the standard LANSA debug interface.
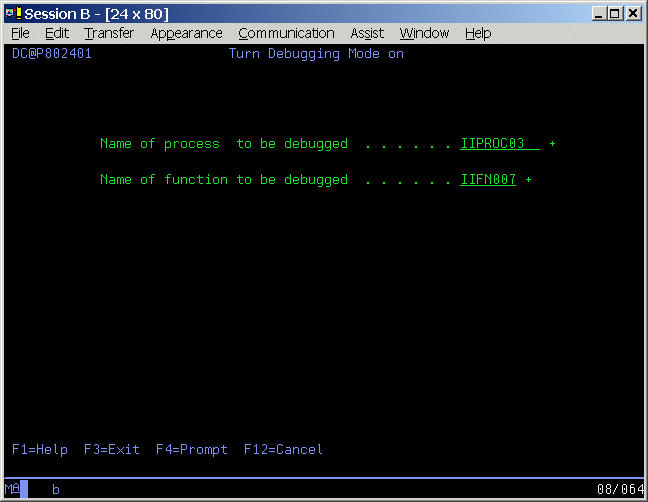
3. Specify the iiiPROC03 process and iiiFN07 function for debug.
Press Enter to continue.
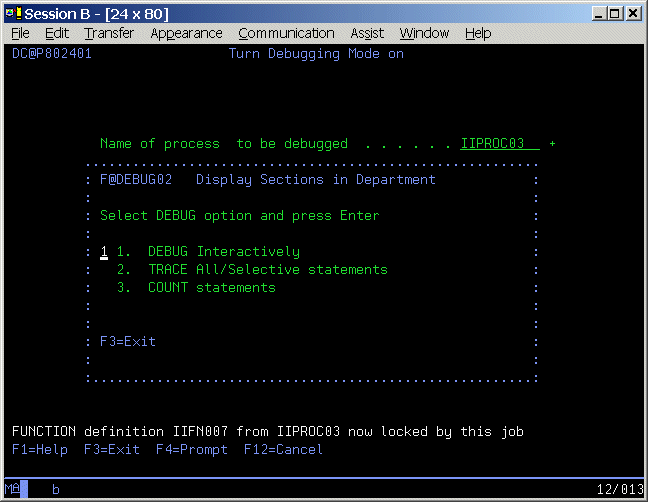
4. Your display screen shows three options. 1.DEBUG Interactively, 2.TRACE All/Selective statements, and 3.COUNT statements.
Select option 1.DEBUG Interactively:
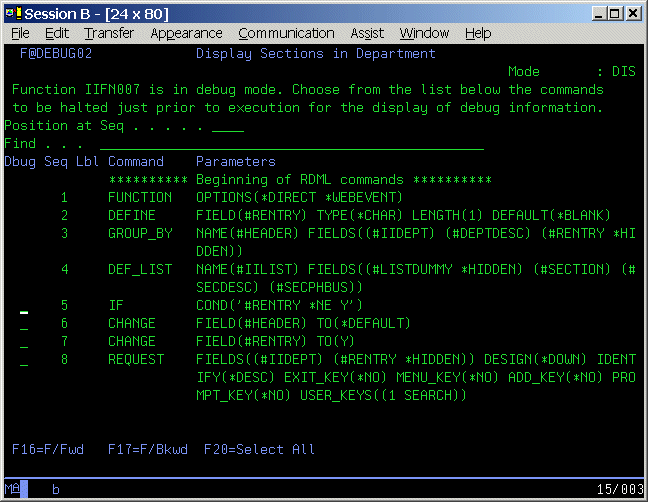
5. A listing of your RDML source code for function iiiFN07 will appear. Beside each statement you will notice there is a selection box. You can select break points for individual lines of code or all lines of code.
For this exercise, use F20-Select all:
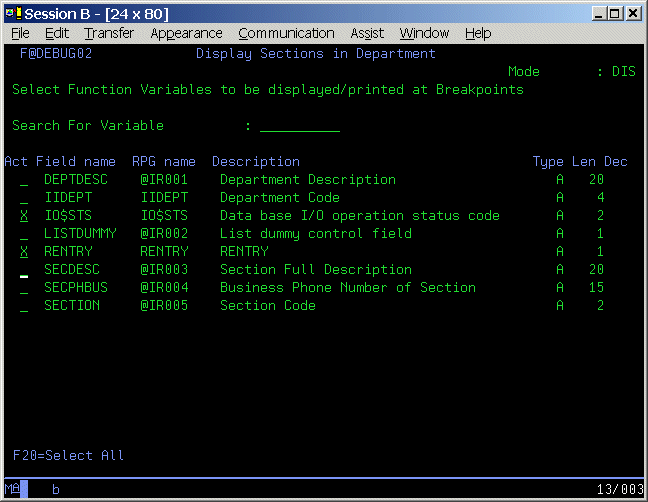
6. A listing of all fields referenced by your function should now appear. Please select the fields, IO$STS and RENTRY.
Press Enter to allow your function to begin execution.
7. The first executed line of source code will appear with the variables IO$STS and RENTRY shown below it.
Press Enter to advance the debugger through each line of code. Remember, for WEBEVENT functions, a screen is not sent to the browser until the function terminates.
Take notice of the value of RENTRY and when it changes from blank to Y.
8. Press Enter until the DEBUG screen resets to a signon display.
Now that your function has terminated, a screen should be displayed in the browser.