3 10 1 Start Development Environment Debugging Session
From LANSA Web Functions
3.10.1 Start Development Environment Debugging Session
In the tab of the , locate the Web function to be debugged. Right click on it to open the context menu. Select from the context menu.
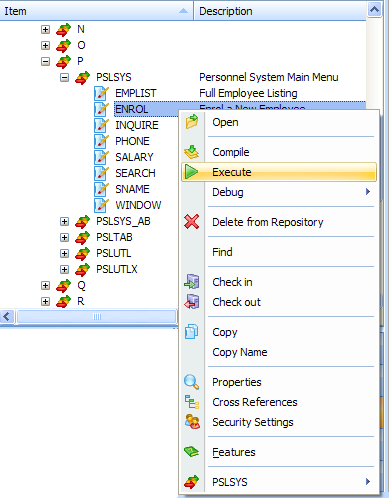
The Execute dialog will be displayed:
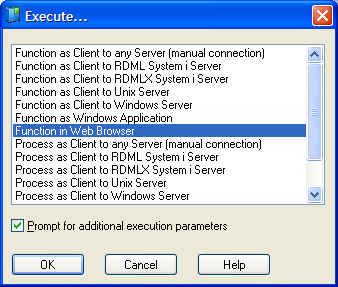
Select either or to execute the selected Web function.
Select (check) the option to open the following dialog where you can specify that you want Debugging to be activated. If the option is not selected, the function or process will be run without any debugging session.
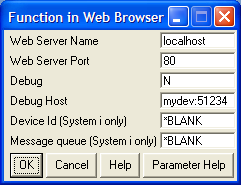
Check that the and are correct for your installation.
Change the parameter from N to Y to start the Web function for debugging.
For IBM i batch debug, you need to specify the and . (IBM i Batch Debug is not done within the Visual LANSA Development Environment.)
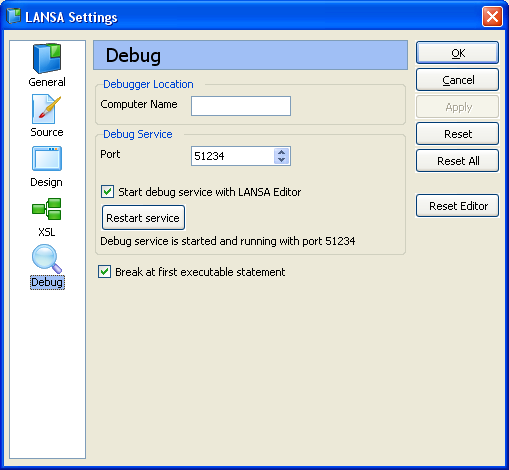
is set by default according to LANSA Debug Settings (see Debug in LANSA Settings in the ) and refers to the Visual LANSA development environment that you want to use for interactive debugging. Normally, it refers to the current development environment you are using. If you want to temporarily use a different development environment (which can be on a different computer) for the debugging session, you may change Debug Host to a value such as mydevenv:51234. This is name of the computer with the development environment that you want to use and the network port number used by the Visual LANSA Debug Service of that development environment. You will find this information in the dialog of the of the development environment you want to use for debugging.
The parameters and are not used for Visual LANSA interactive debugging.