Stability Plots
From WinEDR
Analysing Single-channel Currents > Stability Plots > Stability Plots
The validity of the channel dwell time analysis is dependent upon the channel gating being in a stationary condition throughout the recording. Stationarity means that the rate constants governing the transitions between channel states are constant and the mean open and closed state dwell times, and open state probability, do not vary during the recording.
The Summary/Stability Plots page provides a set of tools for revealing the presence of trends in the single-channel current amplitudes or dwell times.
To create a stability plot :
1. Select the type of plot to be created form the Plot Type list.
2. Select the All option to use all sample points/events contained in the recording/event list or select Range and enter a time interval/event range to define a selected region.
3. Enter the number of averaging blocks that the analysis region is to be divided into in No. Blocks box.
4. Click the New Plot button to display the plot.
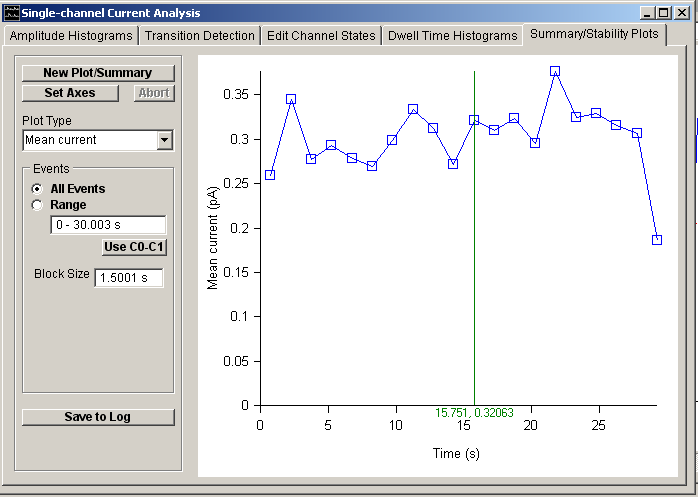
The values of the x,y points in the plot can be read out using the blue readout cursor.
The following parameters can be plotted:
· Mean current: Displays trends in mean currents. The digitised current signal is divided into a series of contiguous blocks, the mean current for each block is computed and plotted vs. the mid-point time for each block.
· Open probability: Displays the probability of a channel being open and is derived from the mean current plot, by dividing the mean block current by the single-channel current value (set on the Amplitude Histograms or Transition Detection page).
· Open times: Displays trends in the channel open state dwell time. The channel event list is divided into a series of contiguous blocks, the mean open state dwell time for each block is computed and plotted vs. the mid-point time for each block.
· Closed times: Displays trends in the channel closed state dwell time.
· Single-channel currents: Displays trends in the amplitude of the single-channel currents. The channel event list is divided into a series of contiguous blocks, the mean single-channel current for each block is computed and plotted vs. the mid-point time for each block.
· Current vs Open times: Dsplays the relationship between open state duration and average open state current. Dwell time and average current for the open states in the event list are displayed as a scatter plot.
· Cursor Meas. (Avg): Displays (vs time) the average current in the the manual cursor measurements lists.
· Cursor Meas. (Dur): Displays (vs time) the average duration in the the manual cursor measurements lists.
· Cursor Meas. (S.D.): Displays (vs time) the average standard deviation in the the manual cursor measurements lists.