Fitting Curves to Power Spectra
From WinEDR
Noise Analysis > Fitting Curves to Power Spectra
To fit a Lorentzian function to a power spectrum :
1. Select the region of the spectrum to fitted, using the f--f region of interest cursors. 
2. Select the function to be fitted (Lorentzian, 2 Lorentzians) from the Fit Curve list.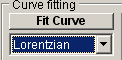
3. Click the Fit Curve button. Set the initial parameter guesses (optional) 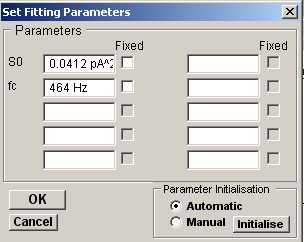
and click the OK button.
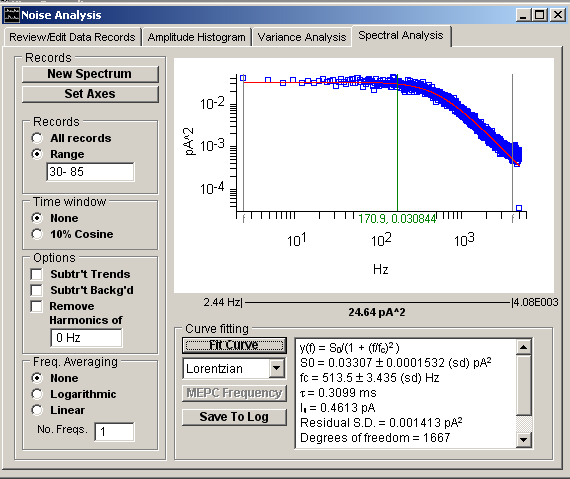
The best fitting curve is superimposed upon the spectrum and the best fit function parameters (zero frequency spectral power, S0 and corner frequency, fc,) along with the parameters standard errors and residual standard deviation are displayed in the results box. The single-channel current, Iu, and channel gating time constant are also displayed.
Lorentzian Functions
The spectra of ion channel fluctuations have characteristic shapes represented by the sum of one or more Lorentzian functions,
![]() (1)
(1)
At low frequencies, the function tends to a constant value, S0 (units I2/Hz). At high frequencies the spectrum decays in proportion to 1/f2. The rate of ion channel opening and closure determines the corner frequency, fc, at which the power has declined to S0/2. Channels which rapidly flicker between short open and closed states produce higher frequency noise and spectra with higher corner frequencies. For a channel with two states (open and closed), fc, is related to the ion channel gating time constant, , and the mean open and closed times, topen, tclosed, by the formula,
![]() (2)
(2)
If tclosed >> topen then topen.
If a channel has more than two states then its noise spectrum will consist of a mixture of n-1 Lorentzian functions for n channels state. The relationship between channel dwell times and corner frequencies of the Lorentzian components is more complicated in these cases (See Ruff, 1977).
If the spectrum has been recorded under conditions where the open channel probability is small (e.g. p 0.1), the single-channel current and conductance can also be computed from the power spectrum. For small p values the second term in the eqn. 2 can be neglected leading to a direct relationship between current variance and mean current
![]() (3)
(3)
Since the spectrum is the frequency distribution of the variance, the variance can be calculated from the integral of the Lorentzian function.
![]() (4)
(4)
By combining eqns. 3 and 4 the single-channel conductance can be calculated from the Lorentzian curve fitted to the ionic current power spectrum.
![]() (5)
(5)
(Note. In these circumstances no information can be derived concerning the total number of channels.)
Miniature endplate current noise
It is also possible to analyse the current fluctuations associated with the miniature endplate currents under conditions of the high frequency release evoked by increasing the K ion concentration of the bathing solution. The MEPC noise spectrum can be modelled with the three parameter (Fr, Fd , A) function,
![]() (6)
(6)
Eqn. 6 can be fitted to a spectrum by selecting MEPC Noise from the fitting function list. Parameters Fr and Fd are associated with the MEPC rise and decay time course while A is associated with the overall noise amplitude. The time constants for MEPC rise and decay, r and d, can be computed from these.
After the r and d, time constants have been established by fitting eqn. 6, to the MEPC noise power spectrum, the frequency of MEPC release can be computed by clicking the MEPC Frequency button (on the Variance Analysis page).