Mean State Amplitude Histogram
From WinEDR
Analysing Single-channel Currents > Current Amplitudes > Amplitude Histograms > Mean State Amplitude Histogram
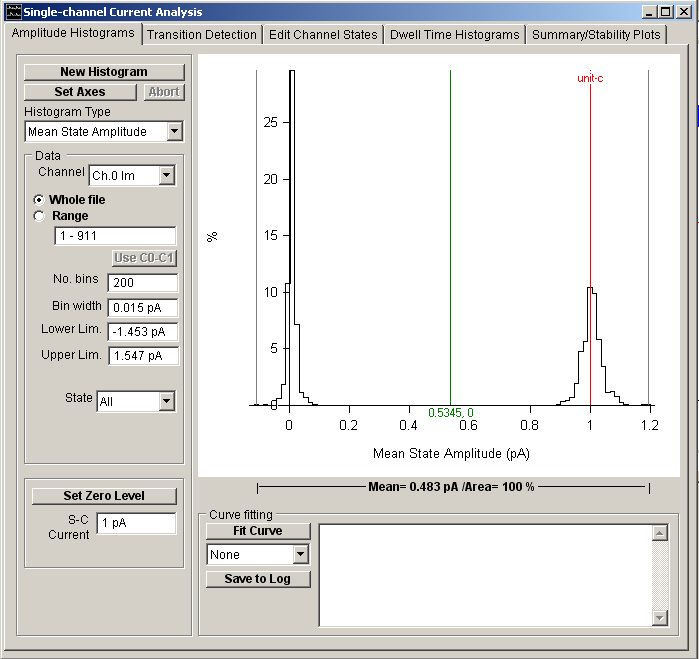
This histogram displays the mean amplitude for each detected channel state, computed from the average of the sample points contained within the selected set of channels states (closed, open, and all). (Note. This option can only be used after transition detection has been completed.)
To compute the histogram :
a) Select Mean State Amplitude from the Histogram Type list.
b) If more than one signal channel is available, select the channel to be used from the Channel list.
c) Select the All option to use all detected channel transition events in the recording or select Range and enter the sub-range of events to be included.
d) Select the channel state(s) (Close, Open(X1) or All) to be included in the histogram from the State list.
e) Enter the width of the histogram bin in the Bin Width box.
f) Click the New Histogram button to compile and display the histogram.
Note. The Exclude Edges entry on the Edit Channel State page determines the number of (zero or more) samples at the beginning and end of each state which are excluded from the average to eliminate the parts of the signal which are in the process of transition between states. States with a duration shorter than twice the Exclude Edges settings are not included in the mean state amplitude histogram.