Cursor Measurements
From WinEDR
Analysing Single-channel Currents > Detecting Channel Transitions > Cursor Measurements
Two pairs of linked cursors, a-a and z-z, can be used to make manual measurements of duration, average current amplitude and standard deviation, and save these to a list. This feature is enabled by ticking the Cursor Measurement Enable option.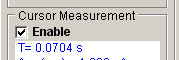
The average current (difference between the average signal within the z-z and a-a cursors), duration (time between the a-a cursors) and standard deviation of the signal within the a-a region) are displayed in the Cursor Measurement box. Clicking the Save to List button saves the displayed measurements to a storage list.
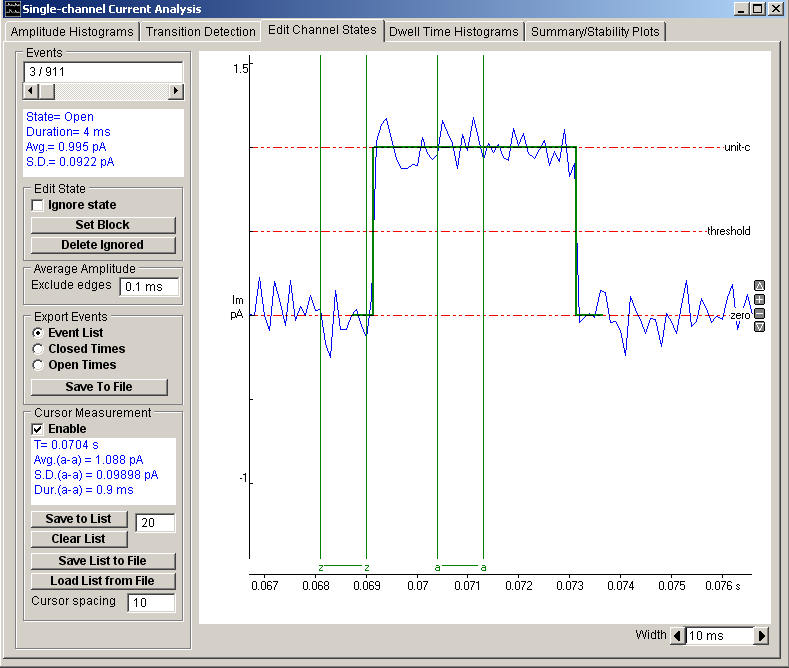
The amplitude, duration and standard deviation measurements stored in this list can be plotted (vs. time) on the Stability Plot page. A histogram of the distribution of amplitude measurements can be plotted on the Amplitude Histograms page.
The cursor measurements list can be saved to an Excel-readable text file by clicking the Save List to File button and entering a file name. Previously saved files can be re-loaded into the measurements list by clicking the Load List from File button.
The default inter-cursor spacing is defined by the Cursor spacing box.