Customising Histogram Plots
From WinEDR
Analysing Single-channel Currents > Current Amplitudes > Customising Histogram Plots
If you want to alter the X or Y axis range, scaling or labels on a histogram, click the Set Axes button to open the dialog box.
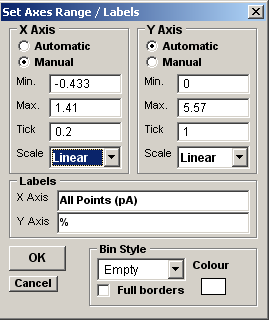
You can change the X or Y axis limits by selecting the Manual Axis option and entering new values into the Min, Max. and Tick (spacing) boxes. An axis can be made Linear or Logarithmic by selecting the option from its Scale list. Labels for the X and Y axes can be entered into the Labels boxes.
The style of rectangle used to plot the histogram bins can be changed using the Bin Style options. Select No Fill to display bins as rectangular outlines, Solid Fill to fill the bins in with a solid colour, and Hatched Fill for bins filled with a diagonal lines. You can define the colour used for the solid fill, by clicking the Colour box, and selecting a colour from the palette. The Full Borders check box determines whether the outline is drawn completely around each bar, or just where bars do not overlap.