Resistance
From WinEDR
Recording Experimental Signals > Special Modes > Resistance
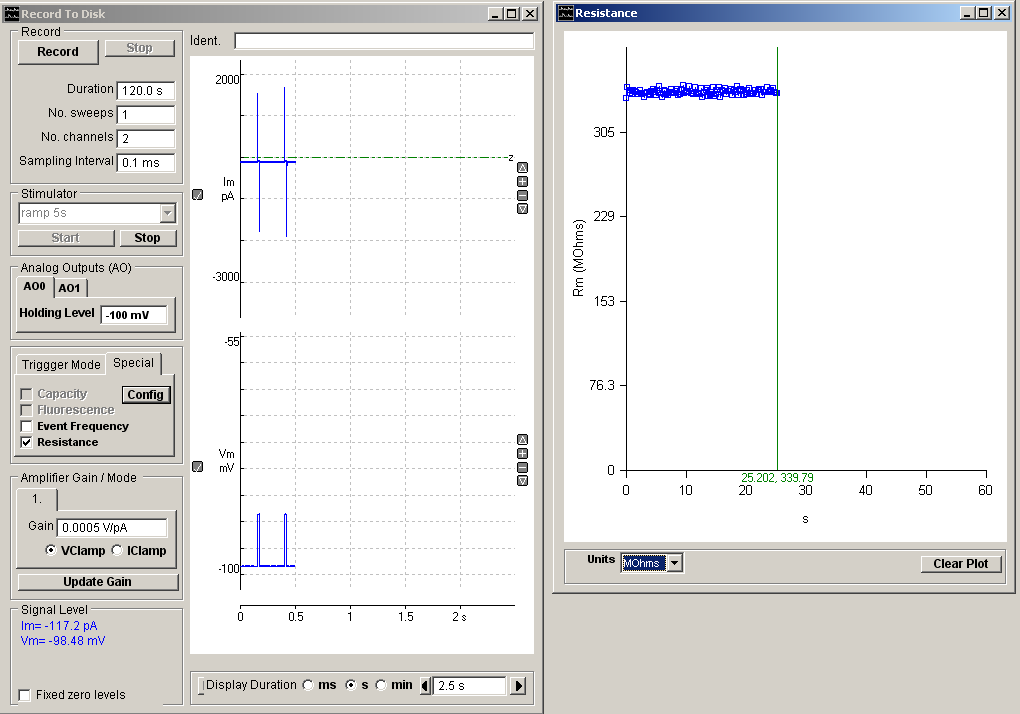
Selecting the Resistance special option opens a display window showing cell resistance or conductance obtained from a voltage test pulse applied to the cell.
The test pulse properties and the selected current and voltage channels are configured on the Resistance page of the Computed Channels dialog box.
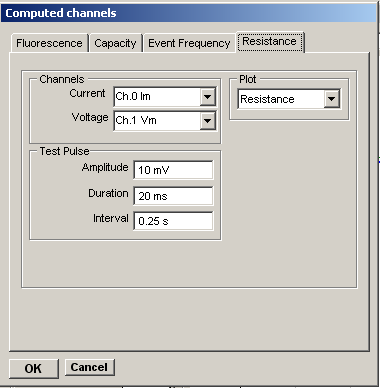
To configure the resistance plot:
1. Select the input channel on which the current signals are to be detected from the Current channel list.
2. Select the input channel on which the voltage signals are to be detected from the Voltage channel list.
3. Set the amplitude of the test pulse in the Amplitude box.
4. Set the duration of the test pulse in the Duration box.
5. Set the interval between pulses in the Interval box.
6. Select the type of plot to be produced from the Plot list. Plots of cell resistance, conductance, steady state pulse current and voltage can be produced.
 The
The
The data displayed on the selected plot is stored in text file in the data folder.