Recording Experimental Signals > Recording Signals
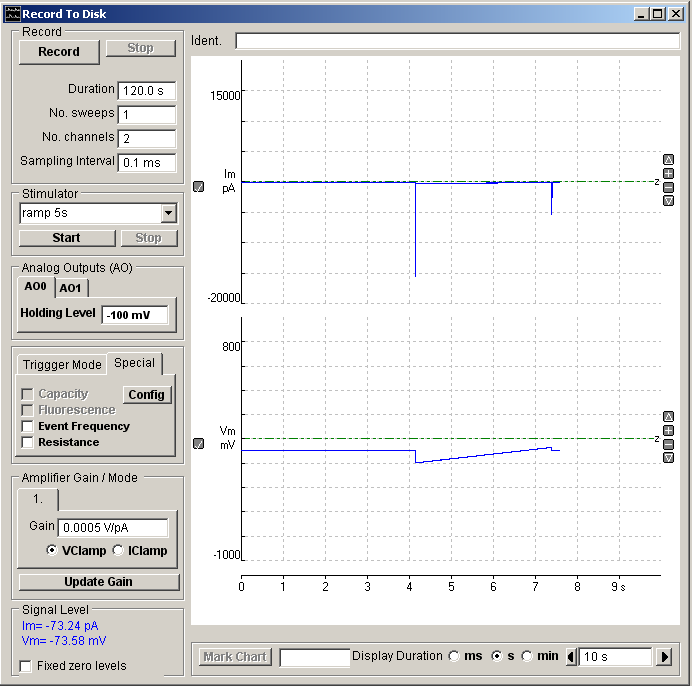
To make a recording of signals from your experiment, select
Record
Record to disk
to open the recording window.

The display area of the screen acts like a digital oscilloscope, displaying live traces of the incoming analogue signals.
The Signal Level box provides a readout of the signal level on each input channel. The duration of the live display window can be adjusted using the Display slider bar at the bottom right of the screen or by entering a duration in the Display box.
The vertical magnification for each channel can be expanded to a selected region by moving the mouse to the upper limit of the region, pressing the left mouse button, drawing a rectangle to indicate the region and releasing the mouse button. The vertical magnification can also be adjusted using the + - buttons at the right edge of each plot.
Individual channels can be added/removed from the display by clicking the / button at the left edge of each channel. The vertical area of the display devoted to each channel can be adjusted by dragging the top/left edge of each channel Y axis up or down.