Copying Histograms to the Clipboard
From WinEDR
Analysing Single-channel Currents > Channel Dwell Time Analysis > Copying Histograms to the Clipboard
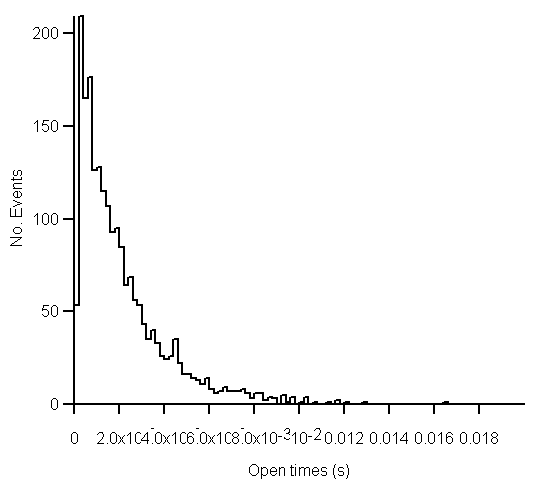
Copying the histogram data points to the Windows clipboard
The numerical values of the X,Y data points which generate the histogram can be copied to the clipboard by selecting
EditCopy Data
The data is placed on the clipboard as a table of data values, in tab text format, defining the histogram. There are 4 values per row, and one row for every bin in the histogram. Each row has the format
<Bin Lower Limit> <tab> <Bin Mid-point> <Bin Upper Limit> <tab> <Bin Count> <cr> <lf>
Copying an image of the histogram to the Windows clipboard
An image of the histogram plot can be copied to the clipboard by selecting
Edit
Copy Image
to open the dialog box.
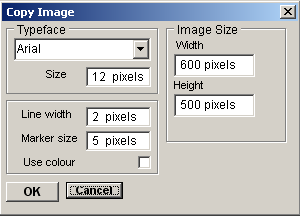
The dimensions (pixels) of the bit map, which will hold the image, can be set using the Width and Height image size boxes. The size and style of the typeface can be set using the Typeface and Size boxes.
When the image parameters have been set, click the OK button to copy the image to the clipboard.