Analysing Single-channel Currents > Channel Dwell Time Analysis > Analysis of Channel Dwell Times
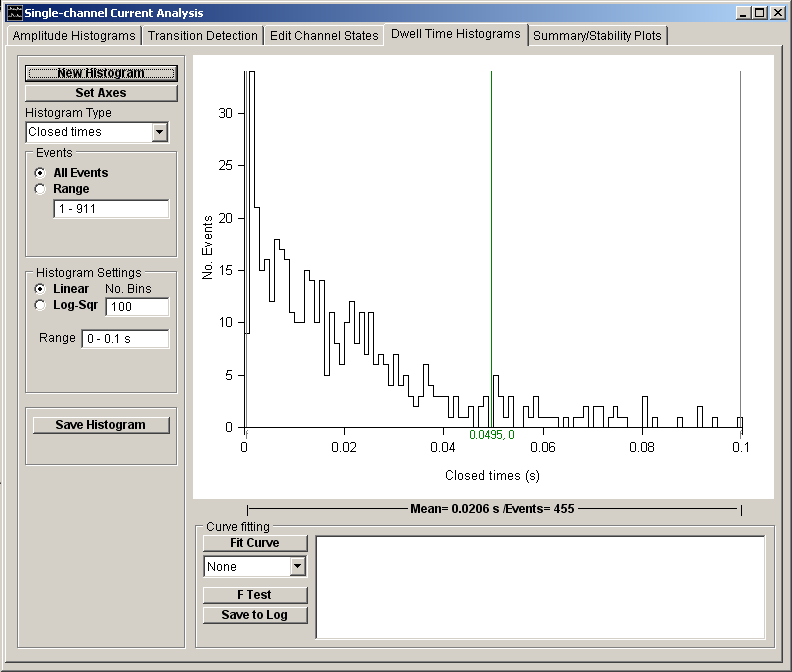
The Dwell Time Histograms page provides tools for compiling and analysing histograms of the distribution of the channel open and closed times determined by the transition detection process. Dwell time histograms can be plotted with linear or logarithmic axes and mean state durations estimated by fitting one or more exponential probability density functions.

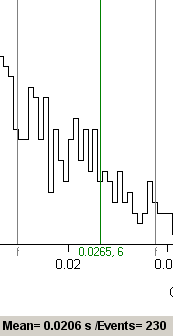
The height of each histogram bin indicates the number of samples falling within the limits of the bin. The number of events within each bin and the dwell time at its mid-point can be read out using the green readout cursor. The number of events contained in the bins falling within a selected range of dwell times, and the mean dwell time of that region, can be displayed by placing the pair of grey ‘f--f’ cursors at the limits of the region of interest.

Seven basic types of histogram can be produced from the dwell time data in the channel state list.
· Open times: distribution of channel open times.
· Closed times: distribution of channel close times.
· Burst Length: distribution of the duration of bursts of openings, a burst being defined as a series of opening interspersed by short closures, terminated by a closure longer than a predefined period.
· Single open times: distribution of open times of channel openings which do not form part of a burst.
· Opens times within bursts: distribution of open times of channel openings which form part of a burst.
· Openings per burst: distribution of the number of channel openings within a burst.
· External file: distribution of times loaded from an external file.