All Points Amplitude Histogram
From WinEDR
Analysing Single-channel Currents > Current Amplitudes > Amplitude Histograms > All Points Amplitude Histogram
The All Points histogram represents the distribution of current amplitude within the digitised record, irrespective of the open/close state of the channel. It is used for initial analysis of the current amplitude distribution, determination of single-channel current amplitude, number of channels in the patch, and the steady-state, open-channel probability, popen.
The current amplitude range is divided into a series of equally spaced bins (up to 512). Each sample point within the digitised signal is allocated to a bin according to the formula
![]()
where Ihi and Ilo are the upper and lower limits of the current range, nb is the number of bins, and I(i) is the current for A/D sample i The distribution is displayed as a histogram of the percentage of the total number of sample points contained within each histogram bin.
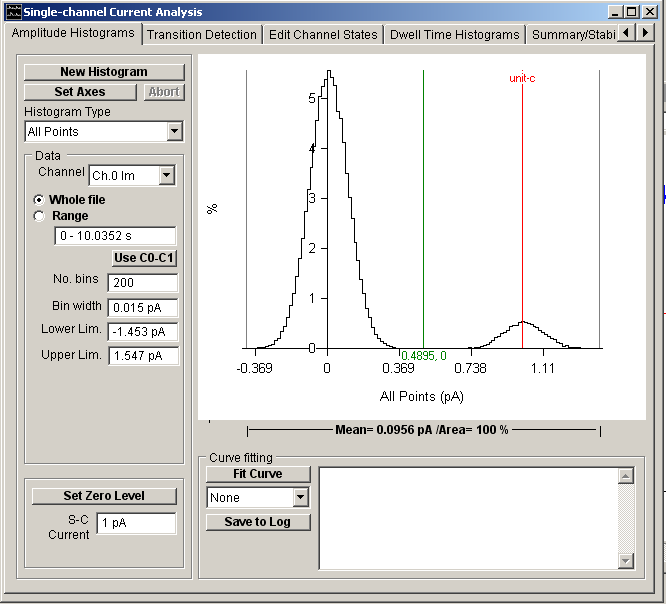
To compile an All Points histogram :
1. Select All Points from the Histogram Type list.
2. If more than one signal channel is available, select the channel to be used from the Channel list.
3. Select the All option to use all sample points contained in the recording or select Range and enter a time interval to use only samples within that region of recording.
4. Enter the width of the histogram bin in the Bin Width box.
5. Click the New Histogram button to compile and display the histogram.