All Points in State Histogram
From WinEDR
Analysing Single-channel Currents > Current Amplitudes > Amplitude Histograms > All Points in State Histogram
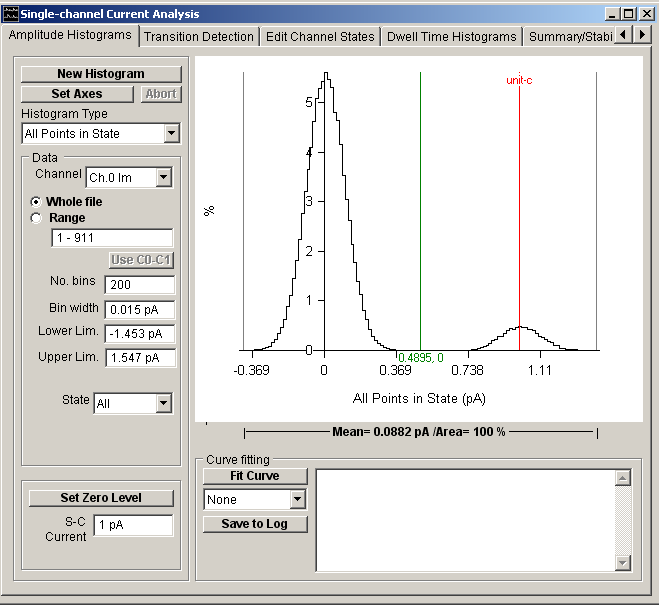
This histogram displays the current amplitude distribution of the sample points contained within a selected set of channels states (closed, open, and all). (Note. This option can only be used after transition detection has been completed.
To plot the histogram:
1. Select All Points In State from the Histogram Type list.
2. If more than one signal channel is available, select the channel to be used from the Channel list.
3. Select the All option to use all detected channel transition events in the recording or select Range and enter the sub-range of events to be included.
4. Select the channel state(s) (Close, Open(X1) or All) to be included in the histogram from the State list.
5. A number of (zero or more) samples at the beginning and end of each state can be excluded from the histogram to eliminate the parts of the signal associated with the transition between states. Enter the number samples to be excluded in the Margin Points box.
6. Enter the width of the histogram bin in the Bin Width box.
7. Click the New Histogram button to compile and display the histogram.