Power Spectra
From WinEDR
Noise Analysis > Power Spectra
The power spectrum is a measure of the frequency distribution of the signal variance. Analysis of the amplitude and shape of the power spectrum provides a means of estimating both single-channel current amplitude and channel gating kinetics. The averaged spectrum is obtained by computing the individual power spectrum for each variance record using the fast Fourier transform, averaging the corresponding frequency components from each record, and [optionally] averaging adjacent frequency components. By convention, the power spectra is then plotted using log-log axes.
Select the Power Spectrum page to compute and plot the averaged power spectrum for a series of variance records.
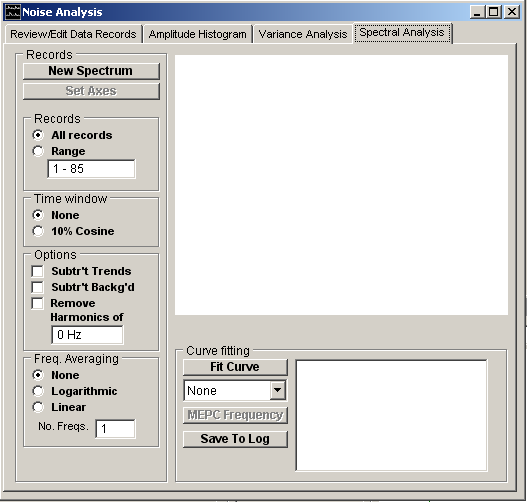
To plot a power spectrum :
1. Select the All Records option to include all available variance records in the spectrum or select Range and enter a specific range of records. (Note. Records marked as Rejected and Background records are excluded.)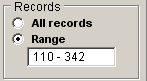
2. Freq. Averaging: Select the type of averaging to be applied to adjacent spectral frequencies. Select None for no averaging. Select Logarithmic to logarithmically increase the number of adjacent frequencies averaged with increasing frequency. Select Linear to average a fixed number of adjacent frequencies throughout the frequency range, the number entered in the No. Freqs. box.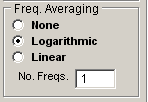
3. Time Window: Select the time window to be applied to the data in each variance record. Select None for no time window. Select 10% Cosine to taper the first and last 10% of data points using a cosine bell function.
4. Options: Tick the Subtr’t Backg’d option to subtract the averaged power spectrum of the Background records from the spectrum of the Test records. (The background spectrum is also plotted ( symbols).)
Tick the Subtr’t Trends option to remove any linear trends from the data points within each variance record before computation of its power spectrum.
Tick the Remove Harmonics of option and enter a base frequency in the box to remove frequencies at multiples of X1 and X2 the base.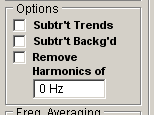
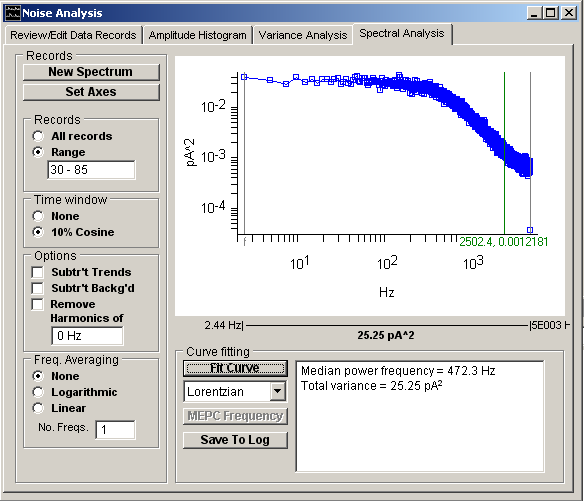
5. Click the New Spectrum button to compute and plot the averaged spectrum.
The spectral power at each frequency component can be displayed using the blue readout cursor. The average variance contained within a range of frequencies indicated by the |--| region of interest cursors is also displayed. The total variance obtained by integrating the spectrum and the median power frequency (frequency below/above which 50% of the variance lies) is displayed in the results box.
A detailed discussion of the computation of power spectra can be found in Dempster (1992 or 2001).