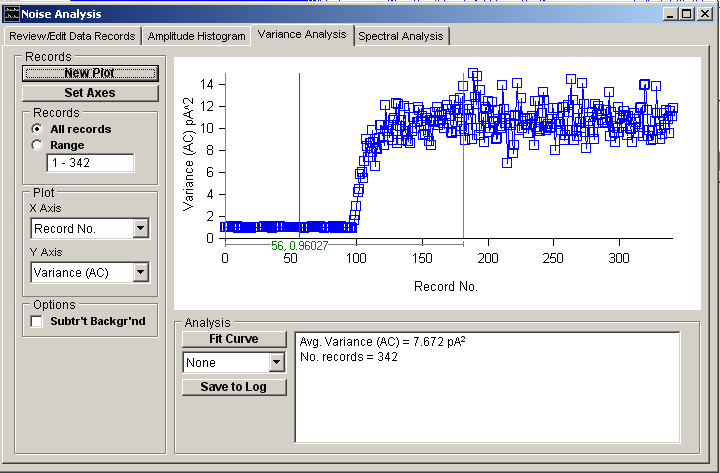
Noise Analysis > Analysis of Signal Variance
Select the Variance Analysis page to display and analyse the mean current, variance and other parameters computed from the variance records.

To select and plot a pair of variables :
1. Define the variable to be plotted on the X axis, by selecting it from the X Axis variable list.
2. Define the variable to be plotted on the Y axis, by selecting it from Y Axis list.
3. Select the All Records option to plot all available variance records or select Range and enter a specific range of records. (Note. Records marked as Rejected and Background records are excluded.)
4. Select the Subtr’t Backg’d option to subtract the average variable value within the Background records from the plotted data
5. Click the New Plot button to plot the graph.Five basic parameters are computed from each variance record and can be plotted against each other.
Five basic parameters are computed from each variance record and can be plotted against each other:
Mean (DC) is the mean current computed with the formula

where I(i) is the ith of the N samples in the variance record.
Variance (AC) is the current variance, 2, computed using the formula

St Dev (AC) is the standard deviation (the square root of Variance (AC)).
Skew (AC) is the current skew, computed using the formula

Median Freq. (AC) is median frequency of the power spectrum calculated from each variance record. (
Note. Variables marked (AC) are computed from the designated AC signal channel (See Variance Records page), if one exists. Variables marked DC are computed from the DC channel.)