Variance-Mean Current Plots
From WinEDR
Noise Analysis > Variance-Mean Current Plots
To plot a variance-mean current curve and estimate single-channel current and number of channel by fitting a parabolic curve:
1. Select a range of variance records from a period of the recording where the mean current is changing.
2. Select Mean Current (DC) from the X Axis list and Variance (AC) from the Y Axis list.
3. Click the New Plot button to plot the variance-mean graph.
4. Select the region of the graph to fitted, using the |--| analysis region cursors.
5. Select Parabola from the Fit Curve list to fit the parabolic equation to the plot.
6. Click the Fit Curve button. Set the initial parameter guesses (optional) and click the OK button.
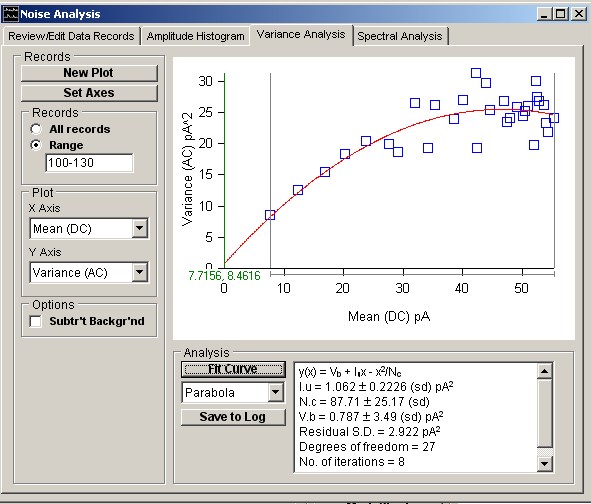
The best-fit single-channel current (Iu), number of channels (Nc) and background variance (Vb), unrelated to channel activity, along with estimated standard error and residual standard deviation are displayed in the fitting results box.
Theoretical Background
An estimate of the single-channel current and the number of channels in the cell (or patch) can be obtained by plotting current variance vs. mean current. For a cell containing a population of nc ion channels, each capable of passing a current, Iu, and a probability, p, of being open at any given time, the mean current for the whole cell is
![]()
The variance of the current fluctuations is
![]()
These two equations can be combined to provide a parabolic relationship between 2 and Im,
![]()
Estimates of Iu and nc can thus be obtained from plots of current variance vs. mean current by fitting the above using non-linear curve fitting.
Examples of the use of variance-mean plots and a discussion of the issues involved can be found in Cull-Candy et al (1988), Dempster (1992, 2001).