Fitting Gaussian Functions to Histograms
From WinEDR
Analysing Single-channel Currents > Current Amplitudes > Fitting Gaussian Functions to Histograms
The peaks of the current amplitude histogram can often be fitted by a mixture of one or more gaussian probability density functions. The height y(i), of bin i with its mid-point at current I(i), is given by
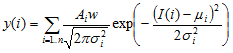
where w is the histogram bin width. Each gaussian component is defined by 3 parameters; Ai the percentage of the total area under the component, i the mean current, and i the standard deviation about the mean value. WinEDR uses an iterative least squares curve fitting procedure to find the gaussian function which best fits the histogram data. Fitting a gaussian curve provides a convenient way of estimating the mean current for a channel state and the percentage of time spent in that state. In cases where the peaks are partially overlapping, mixtures of gaussians can be fitted simultaneously, allowing the relative proportions of each to be estimated.
To fit a gaussian curve to a histogram:
1. Define the range of amplitudes containing the peak(s) to be fitted using the pair of grey ‘|’ region of interest cursors.
2. 
3.
4. Select the number of Gaussian functions to be fitted from the Curve Fitting list.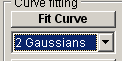
5. Click the Fit Curve button and enter an appropriate set of initial guesses for the gaussian function parameters (i, i, Pki) (Note. A set of initial guesses are computed automatically, but it is often necessary to adjust these to better match the location and size of the observed histogram peaks). Individual parameters can also be fixed at their initial values by ticking its associated Fixed option. 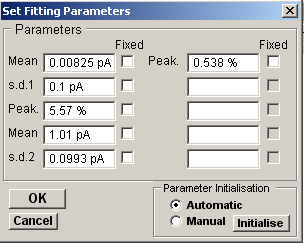
Click the OK button to begin fitting.
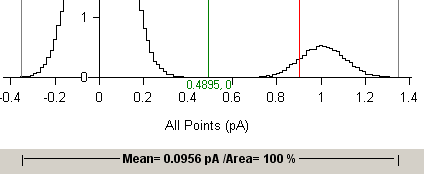
The best fitting gaussian function(s) are superimposed (in red) on the histogram. The values of the function parameters along with their estimated standard errors are displayed in curve fitting results area at the bottom of the display.
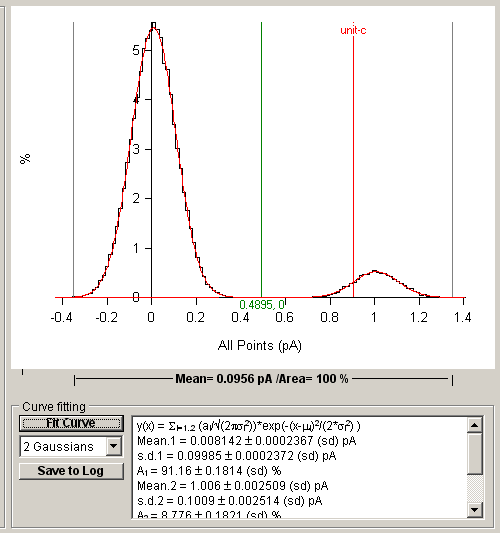
The residual standard deviation (SDres) between the histogram data and the fitted curve provides a measure of the quality of the fit, the smaller the SDres the better the fit.
Note. The fitting procedure will generally work well when fitting gaussian curves to distributions with single peaks or two reasonably well separated peaks which do not differ by more than an order of magnitude in height. In other cases, such as overlapping 3-4 peak distributions the large number of free parameters can cause the procedure to fail to converge to a meaningful result. In such cases it is sometimes possible to obtain a better fit using a two stage procedure. First, a single gaussian is fitted to the largest and best defined peak. Then the resulting best fit parameters for that peak are used as fixed parameters in a 2 (or more) gaussian fit to the remaining peak.