Plotting Histograms of Event Analysis Measurements
From WinEDR
Detecting & Analysing Events > Plotting Histograms of Event Analysis Measurements
The Histogram page allows histograms of the distribution of event analysis measurements to be plotted.
Plotting a Histogram
To plot a histogram :
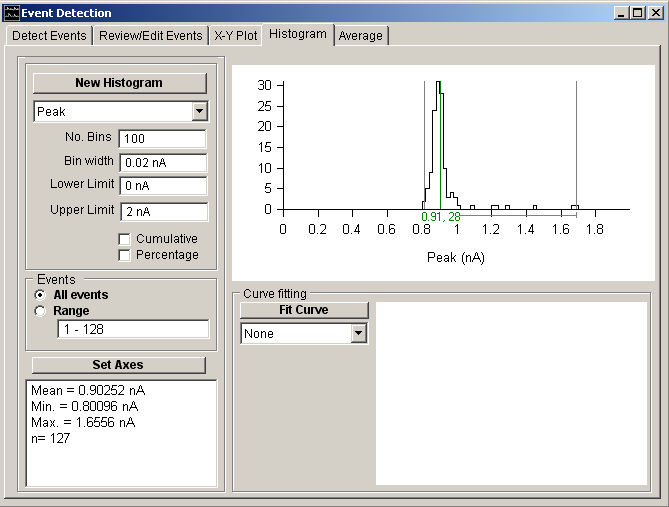
1. Select the variable to be plotted from the Histogram variable list.
2. Select the All Events option to plot the results from all events in the list or select Range and enter a selected range of events.
3. Define the upper and lower limits of the range of variable values to be included in the histogram in the Range boxes. (Values outside this range are excluded from the histogram.)
4. Set the number of histogram bins into which the histogram range is divided, in the No. Bins. box.
5. Tick the Percentage check box to plot the histogram vertical axis as a percentage of the total number of events (rather than number of events in each bin).
6. Tick the Cumulative check box to plot a cumulative histogram.
7. Click the New Histogram button to display the plot.
8. If you want to customise the axes ranges, click the Set Axes button.
Fitting Gaussian Curves to Histograms
To fit a gaussian curve to a histogram:
1. Define the range of amplitudes containing the peak(s) to be fitted using the pair of grey ‘|’ region of interest cursors.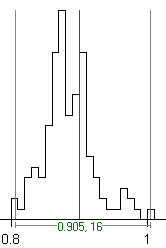
2. Select the number of Gaussian functions to be fitted from the Curve Fitting list.
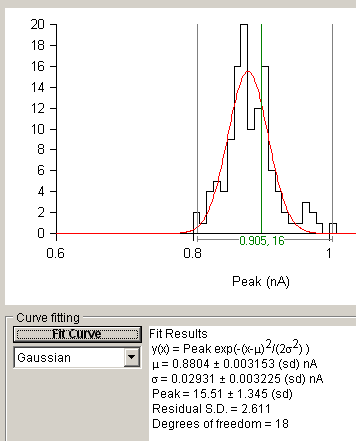
3. Click the Fit Curve button and enter an appropriate set of initial guesses for the function parameters. A set of initial guesses are computed automatically, but it is often necessary to adjust these to better match the location and size of the observed histogram peaks. Individual parameters can also be fixed at their initial values by ticking the associated Fixed option. 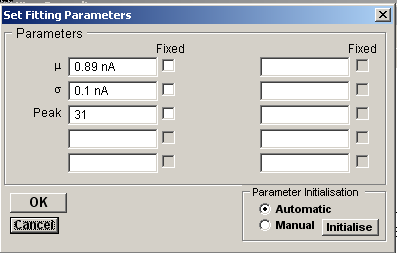
Click the OK button to begin fitting.
The best fitting gaussian function(s) are superimposed (in red) on the histogram. The values of the best fitting function parameters along with their estimated standard errors are displayed in curve fitting results area at the bottom of the display.