Patlak Average Histogram
From WinEDR
Analysing Single-channel Currents > Current Amplitudes > Amplitude Histograms > Patlak Average Histogram
This is an implementation of a method developed by Joseph Patlak (Patlak, 1988) for improving the resolution of All Points histograms without resorting to transition detection procedures. The amplitude histogram is compiled from the running average of a series of n (2 n 256) adjacent sample points. To avoid smearing of the distribution by including averages which contained transitions between states the standard deviation of the n-point average is also calculated and the measurement excluded if it exceeds a preset threshold.
A typical value of n would be 16. The variance threshold is normally set to be the variance of a stable open or closed state. In such circumstances, about 30% of all averages are exclude from the histogram.
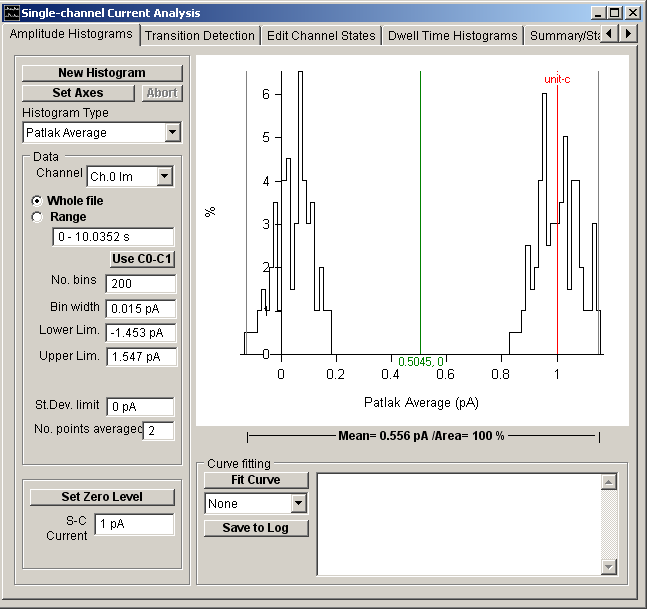
To compute the histogram:
1. Select Patlak Average from the Histogram Type list.
2. If more than one signal channel is available, select the channel to be used from the Channel list.
3. Select the All option to use all sample points contained in the recording or select Range and enter a time interval to use only samples within that region of recording.
4. Enter the number of sample points in the running average in the No points averaged box.
5. Enter the exclusion limit for the running mean standard deviation in the St. Dev. Limit box. (Note. A suitable value is the standard deviation () of a gaussian function fitted to the all points current amplitude distribution around the zero or single-channel currents levels.
6. Enter the width of the histogram bin in the Bin Width box.
7. Click the New Histogram button to compile and display the histogram.
The Patlak averaging method produces histograms with much narrower, better defined, peaks than All Points histograms. It is thus useful for resolving and viewing closely spaced sub-conductance levels. However, it should be borne in mind that the averaging process is biased in favour of longer lasting states and short-lasting events tend to be excluded from the histogram. It cannot be used to compute open channel probability values.