Analysis of Current Amplitudes
From WinEDR
Analysing Single-channel Currents > Current Amplitudes > Analysis of Current Amplitudes
Select the Amplitude Histograms page to compute and plot histograms of the distribution of current amplitudes within a single-channel recording.
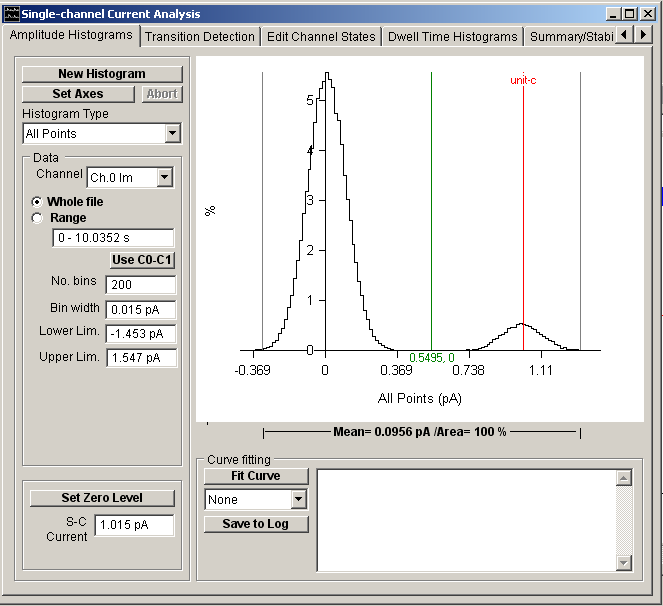
Current amplitude histograms generally have at least two peaks, associated with the closed and open states of the ion channels. The horizontal distance between the peaks indicates the current passing through a single channel. The width of the peaks indicate the amount of background noise degrading the current signal. The area under each peak indicates the proportion of time spent in that particular channel state. A channel which is predominantly in the closed state will, for instance, have a large peak at the zero current level and a small one at the single-channel current level. Channels which have than one open conductance or patches which contain more than one channel will often result in histograms with more than two peaks.
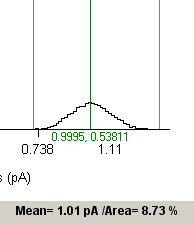
The height of each histogram bin indicates the percentage of samples falling within the limits of the bin. The % within each bin and the current at its mid-point can be read out using the green readout cursor. The mean current and % of samples falling within a selected range of amplitudes can be computed by placing the pair of grey ‘|--|’ cursors at the limits of the region of interest.
Six types of current amplitude histogram can be produced.
· All Points
· All Points in State
· Mean State Amplitude
· Patlak Average
· Cursor Measurements (avg)
· External file