Averaging Events
From WinEDR
Detecting & Analysing Events > Averaging Events
The averaged waveform of a series of events can be computed and displayed on the Average page. Averages can be computed from a specified range of events or using the count-matched averaging process to average the n largest events.
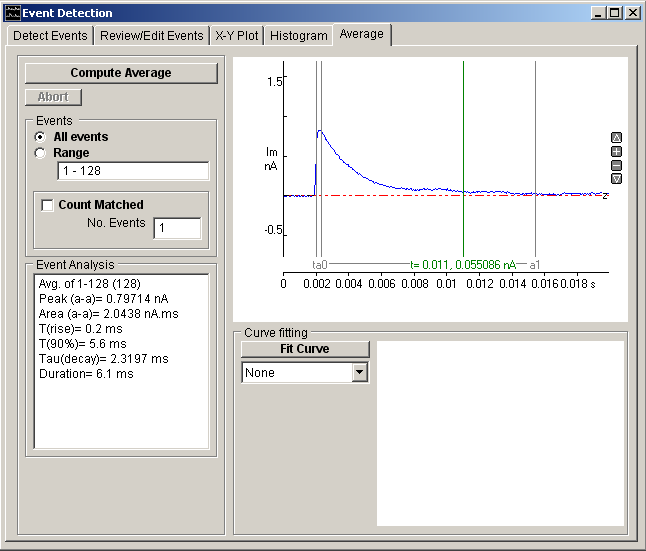
Computing Averages
To compute the event average waveform:
1. Select the All Events option to average all detected events or select Range and enter a selected range of events.
2. Select the Count-Matched option if you wish to compute a 'count matched' average and enter the number of events to be averaged in the No. Events box. (The count matched average is an average of a defined number of the largest amplitude events within the selected event range. It provides a method for comparing average event amplitude before and after an experimentally-induced reduction in amplitude which compensates for the failure to detect small events which have fallen below the detection threshold. See Stell & Mody, J. Neuroscience, 2002, Vol 22, RC223.)
3. Set the % of the averaged waveform, to be before the event detection point in the Pre detection samples box.
4. Set the Event Analysis Polarity of the average waveform measurements. Select Positive for positive-going waveforms and Negative for negative-going.
5. Define the peak detection region using the pair of “a” cursors. (This option can be used to exclude stimulus artefacts or other signals feature from the waveform analysis)
6. Click the Compute Average button to calculate and display the average waveform.
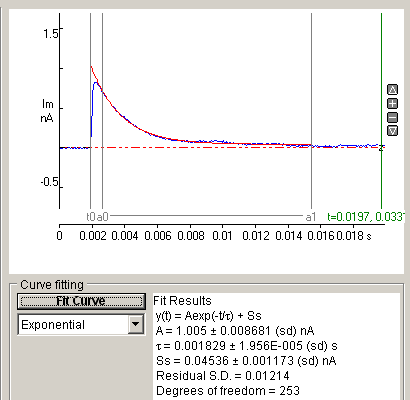
Fitting curves to averages
To fit one or more exponential functions to the average:
1. Define the segment of the average waveform be fitted using the pair of ‘a0-a1’ analysis region cursors. Define the starting point (time = 0) of the exponential function to be fitted, using the t0 cursor.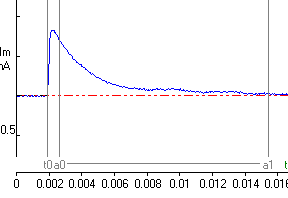
2.
3. Select the number of exponential functions to be fitted from the Curve Fitting list.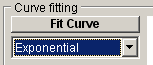
4. Click the Fit Curve button and enter an appropriate set of initial guesses for the exponential function parameters. Individual parameters can also be fixed at their initial values by ticking its associated Fixed option. 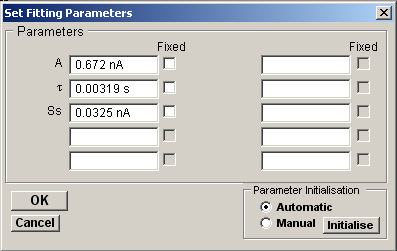
Click the OK button to begin fitting.
The best fit curve us superimposed in red over the fitted region of the waveform. The parameters of the best fitting equation are displayed in the Curve Fitting results area.