Special Lists: Graph
Graphs show one or more field's information in a graphical format. In the current version you can display area, bar, line, pie, scatter and surface charts. For more information refer to the Features online help of the GraphType property.
A pie chart displays data from a single field whereas the other charts can display data from several fields. Scatter and surface graphs require a minimum of two data fields.
As in other lists, the fields are represented as columns. The columns that contain data to be graphed (numeric data) are defined as ColumnRole(Data) the columns which contain textual information are defined as ColumnRole(Label). The ColumnRole can also be set to None which hides and disables the column. This is useful when you have several columns in your graph and you change the data being displayed dynamically.
The different graph types can have different style settings. These are set using the AreaStyle, BarStyle, LineStyle, PieStyle, ScatterStyle and SurfaceStyle properties.
When you are graphing minimum, maximum, average and total values, you can use the KEEP_XXXXX commands to calculate the values. For instance you could display average salaries per section by defining a #SALARYAVG field and storing the average value of the #SALARY field in it:
*(Department loaded and selected previously)
EVTROUTINE HANDLING(#PHBN_1.Click)
clr_list #grph_1
select (#section #secdesc) from_file(sectab) with_key(#deptment)
select #salary from_file(pslmst1) with_key(#deptment #section)
KEEP_AVG OF_FIELD(#SALARY) IN_FIELD(#SALARYAVG)
endselect
add_entry #grph_1
endselect
ENDROUTINE
Graphs receive the ItemGotSelection event when the user clicks on a section of the graph. This event will set the current entry for the graph columns. For instance if you click on bar representing an employee in a bar chart, that employee becomes the current entry in the graph. You can use this feature to provide more information about the current entry for instance in a message box or another graph.
The following pie chart shows the percentage of total salaries earned by individual employees.
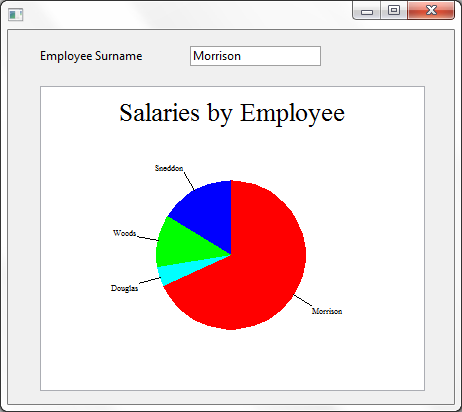
If you run the graph, notice how the surname (CurrentItem) changes when you click on different sections of the pie (ItemGotSelection event).
Here is the source for the graph:
FUNCTION OPTIONS(*DIRECT)
*Definitions
BEGIN_COM HEIGHT(412) LEFT(218) TOP(160) WIDTH(462)
DEFINE_COM CLASS(#PRIM_GRPH) NAME(#GRAPH) DISPLAYPOSITION(1) HEIGHT(305) LEFT(32) PARENT(#COM_OWNER) TABPOSITION(1) TOP(56) WIDTH(385) PIESTYLE(AUTOARRANGELABELS)
DEFINE_COM CLASS(#PRIM_GRCL) NAME(#GRCL_1) DISPLAYPOSITION(2) PARENT(#GRAPH) SOURCE(#SALARY)
DEFINE_COM CLASS(#PRIM_GRCL) NAME(#GRCL_2) COLUMNROLE(Label) DISPLAYPOSITION(1) PARENT(#GRAPH) SOURCE(#SURNAME)
DEFINE_COM CLASS(#SURNAME.Visual) NAME(#SURNAME) DISPLAYPOSITION(2) HEIGHT(20) LEFT(32) PARENT(#COM_OWNER) TABPOSITION(2) TOP(16) WIDTH(281)
*Get data, add it to the graph and set the caption and the type
EVTROUTINE HANDLING(#graph.initialize)
CLR_LIST NAMED(#GRAPH)
SELECT FIELDS(#SALARY #SURNAME) FROM_FILE(PSLMST) WHERE('#SALARY > 90000' )
ADD_ENTRY TO_LIST(#GRAPH)
ENDSELECT
Set #GRAPH CAPTION('Salaries by Employee' )
Set #graph GRAPHTYPE(Pie)
ENDROUTINE
END_COM