

Displaying State Diagrams
The state diagram records the state quantities of important components and depicts them graphically.
You may use several state diagrams in one window as well as to display several components in the same diagram. By dragging a component on the diagram you will add the component to the state diagram. A selection dialog will open where you may select the state variables to be logged as well as to define different colors. Dragging on the diagram again will reopen the dialog, allowing you to change your choice. In case no state variable of a component is selected, the component will be removed from the diagram.
 When in edit
mode please double-click the state diagram or select the menu
option Edit- Properties....
When in edit
mode please double-click the state diagram or select the menu
option Edit- Properties....
The following dialog box opens:
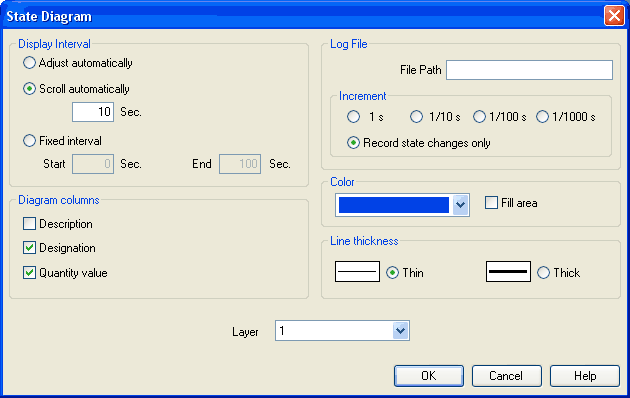
Description of the dialog box:
- Display
IntervalThis is where you may
enter starting point and terminal point of the interval,
defining how the state variables be logged. Prior to the
simulation, you don't need to necessarily know when the
interesting events are going to happen; the display interval
may also be changed after the simulation, since FluidSIM
internally logs all values all the time of the
simulation.
If you select the field “adjust automatically”, the defined limits will be ignored and the time axis will be scaled in such way that the entire period of the simulation can be displayed.
Activate the field “run automatically”, if the diagram is to the last n seconds. In this case, the time axis will be displaced to the left-hand side once the simulation period exceeds the defined time window. In the input field you may define how many seconds are to be displayed in the applicable time window. - Log
File
The state values be written to a file. To enable this option enter the complete path of a file and set a reasonable step width.
Note that a large amount of data can be written the step width is very small. Hence, if necessary, shorten the simulation interval or increase the step width.
If the option “Record state changes only” is enabled, FluidSIM lists only values if at least one state variable incurred a state change. This option simplifies the detection of interesting simulation points- - Color
Defines the color of the diagram. It is set by clicking on the down-arrow at the right-hand side of the list and selecting a color. - Fill
Area
Defines whether the entire diagram or only its frame is filled with specified the color. - Line
Thickness
This is where you define whether curves in the diagram are to be thick or thin. Thin lines are appropriate for exact reading of the values, thick lines are appropriate for spotting the curve from a distance. - Diagram
Columns
This is where you select the columns to be displayed at the left-hand side of the diagram. The columns “Description”, “Designation” and “Quantity value” can be combined to your choice. - Layer
Sets the drawing layer of the diagram. It is set by clicking on the down-arrow at the right-hand side of the list and selecting a layer.
Depending on drawing layer the diagram may be invisible or not selectable. In such a case the drawing layer must be activated via View- Layers... before the diagram can be modified.
Recording state quantities in the state diagram
|
Component |
State |
|
Cylinder |
Position |
|
Way valve |
Position |
|
Pressure Meter, Accumulator |
Pressure |
|
Shutoff Valve and Flow Control Valve |
Opening Level |
|
Pump, Engine |
Speed |
|
Swivel Cylinder |
Position |
|
Pressure and Switching Valves |
Status, Pressure |
|
Flow Control Valves |
Flow |
|
Flow meter |
Flow, Volume |
|
Switch |
Status |
|
Relay, Valve Solenoid |
Status |
|
Indicator Light, Buzzer, Pressure Indicator |
Status |
|
Counter |
Status, Counter Value |
|
Function Generator, Voltmeter |
Voltage |
|
Status Controller, PID-Controller |
Voltage |