JSM Console
Basic system information can be obtained from the JSM console such as total and free memory and the current number of threads running in the JVM.
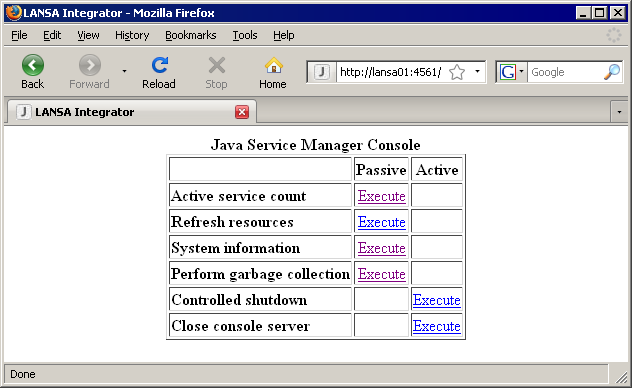
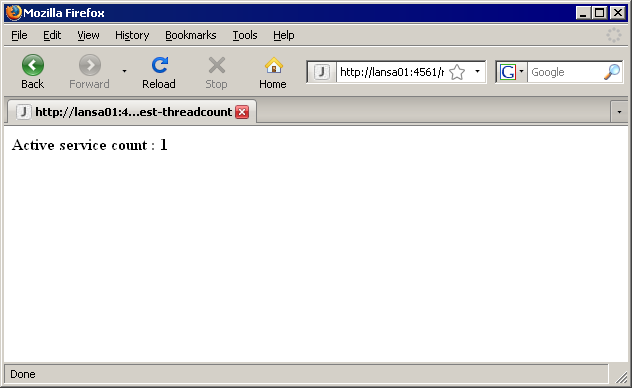
The active service count is the number of service threads that are running.
For more information, refer to Java Service Manager Console.
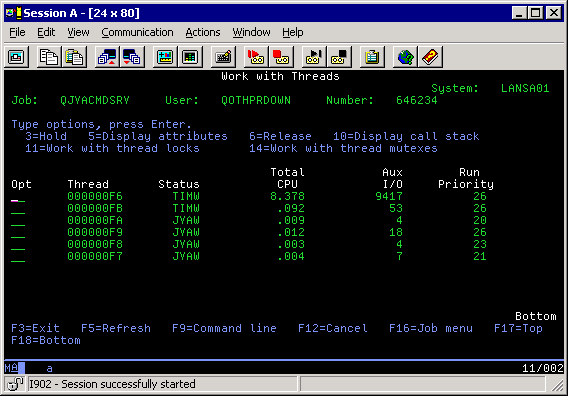
Use the Work with threads or the Java Virtual Machine options from the WRKACTJOB command to view Java runtime information. The following image illustrates the options.
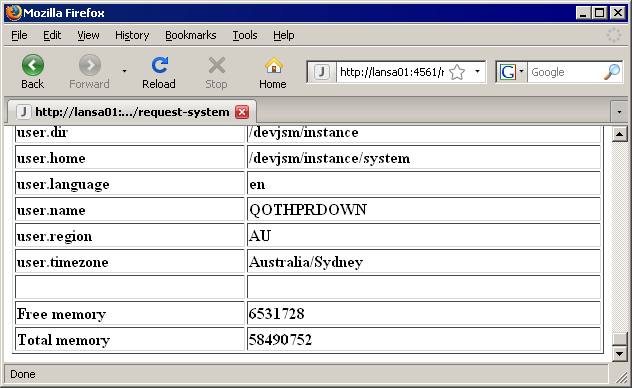
The console system information displays the JVM system properties, but also the free and total memory amounts are displayed.
When the system is running services the free memory will decrease and increase as objects are created and reclaimed by the garbage collection process.
If more memory is required the total memory will increase.
Total memory will never decrease and memory will be only returned to the operating system when the JVM environment ends.