Phase Measurements
Knowledge of both magnitude and phase characteristics is needed for successful higher-level component integration.
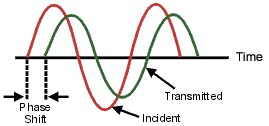
Phase measurements are made using S-parameters, just like amplitude measurements. A phase measurement is a relative (ratio) measurement and not an absolute measurement. Phase measurements compare the phase of the signal going into a device (the incident signal) to the phase of the device's response signal. The response signal can be either reflected or transmitted. Assuming an accurate calibration has been performed, the difference in phase between the two signals (known as phase shift) is a result of the electrical characteristics of the device under test.
The following graphic shows the phase shift (in time or degrees) between an incident signal and a transmitted signal (as might be seen on an oscilloscope display).

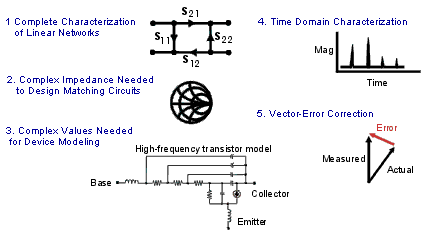
Measuring phase is a critical element of network analysis. The following graphic lists five reasons for measuring both magnitude and phase.

When used in communications systems to pass signals, components or circuits must not cause excessive signal distortion. This distortion can be:
Linear, where flat magnitude and linear phase shift versus frequency is not maintained over the bandwidth of interest.
Nonlinear, such as AM-to-PM conversion.
It is important to measure how reflective a component or circuit is, to ensure that it transmits or absorbs energy efficiently. Measuring the complex impedance of an antenna is a good example.
Using the Analyzer's Phase Format
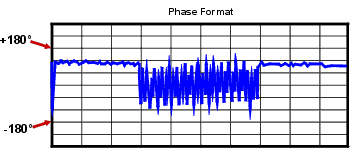
The analyzer's phase format displays a phase-versus-frequency or phase-versus-power measurement. The analyzer does not display more than ±180 degrees phase difference between the reference and test signals. As the phase value varies between +180 degrees and -180 degrees, the analyzer display creates the sawtooth pattern as shown in the following graphic.

The sawtooth pattern does not always reach +180 degrees and -180 degrees. This is because the measurement is made at discrete frequencies, and the data point at +180 degrees and -180 degrees may not be measured for the selected sweep.
Complex impedance data is information such as resistance, reactance, phase, and magnitude that can be determined from an S11 or S22 measurement. Complex impedance data can be viewed using either the Smith Chart format or the Polar format.
AM-to-PM conversion is a measure of the amount of undesired phase deviation (PM) that is caused by amplitude variations (AM) of the system. AM-to-PM conversion is usually defined as the change in output phase for a 1-dB increment in the input power to an amplifier (i.e. at the 1 dB gain compression point). This is expressed in degrees-per-dB (°/dB).
Deviation from linear phase is a measure of phase distortion caused by a device. Ideally, the phase shift through a device is a linear function of frequency. The amount of variation from this theoretical phase shift is known as its deviation from linear phase (also called phase linearity).
Group delay is another way to look at phase distortion caused by a device. Group delay is a measure of transit time through a device at a particular frequency. The analyzer computes group delay from the derivative of the measured phase response.
Deviation from Linear Phase Versus Group Delay
Although deviation from linear phase and group delay are similar measurements, they each have their purpose.
The following are the advantages of deviation from linear phase measurements:
Less noisy than group delay.
Able to characterize devices that pass phase modulated signals, and show units of phase rather than units of seconds.
The following are the advantages of group delay measurements:
More easily interpreted indication of phase distortion than deviation from linear phase.
Able to most accurately characterize a device under test. This is because in determining group delay, the analyzer calculates the slope of the phase ripple, which is dependent on the number of ripples which occur per unit of frequency. Comparing two phase responses with equal peak-to-peak phase ripple, the response with the larger phase slope results in:
More group delay variation.
More signal distortion.
See also Comparing the Analyzer Delay Functions.