Customize the Analyzer Screen
You can customize your analyzer screen by showing or hiding the following display elements. All of these selections are made from the Response > Display menu.
Layout (Separate topic)
Windows (Separate topic)
Measurement Setups (Separate topic)
Marker Display (Separate topic)
Display Colors (Separate topic)
See Also
See other 'Setup Measurements' topics

Status Toolbar

When enabled, the status bar is displayed along the bottom of the screen. The primary status bar shows the following:
TIP: Right-click on many of these items in the status bar for quick access to settings.
Channel Trigger State (Cont, Groups, Single, Hold)
Active channel
Measurement parameter for the active trace
Error correction for the active trace
Averaging Factor for the active channel
Smoothing Percentage
Transform (On)
Gating (On)
Delay if invoked using Phase Offset, Electrical Delay, or Port Extensions.
Loss if invoked using Magnitude Offset or Port Extensions.
GPIB status: Local (LCL), Remote Talker Listener (RMT), or System Controller (CTL).
Error Status: (LVL, LCK, etc)
System Date and Time - Can be set ON or OFF.
Note: A second level status bar appears when using External Test Set Control or Interface control.
The status bar state (ON or OFF) will not change when the analyzer is Preset.
Title Bars
The Title bar shows the window number and Minimize / Maximize icons.
Checked - Title bars for all windows are shown.
Cleared - Title bars for all windows are hidden. This allows more room to display measurement results.
You can display different toolbars to allow you to easily set up and modify measurements.
Your toolbar choices are reset to default settings only on analyzer startup (NOT on Preset).
How to display Toolbars |
|
Using front-panel |
Using Menus |
|
|
|
|
List of toolbars
All Off (does NOT appear on softkeys)
Note: There is also a Cal Set toolbar available for Monitoring Error Terms
Active Entry Toolbar

When used with softkeys, this area allows numeric values to be entered for settings. From the keyboard, enter G for Giga, M for Mega or milli, K for kilo, and so forth.
Softkeys
Softkeys are automatically turned ON when one of the 'function' hardkeys is pressed. This setting allows you to turn the softkeys OFF to show more measurement space on the screen. The softkeys will reappear when another function hardkey is pressed.
Markers Toolbar

The markers toolbar allows you to set up and modify markers. It shows:
Marker number
Stimulation value
Marker functions:
Delta
Start/Stop
Center/Span
Tip: To use the Front Panel Knob to change marker position, first click the Stimulus field of the marker toolbar. Then turn the knob.
Time Domain toolbar

The Time Domain toolbar allows you to do the following:
Turn Transform and Gating ON / OFF
Change the Start / Stop times for both Transform and Gating
More...launches the Time Domain Transform dialog box
X Closes the toolbar
The front panel Tab key steps through all of the settings on all of the toolbars on the display. If Tab does not work, press one of the Active Toolbar (color) keys.
Port Extension toolbar

The Port Extension toolbar allows you to set Port Extensions while viewing the measurement trace. Learn more about Port Extensions.
All Off
This allows you to hide all toolbars with a single selection. NOT available on sofkeys.
Tables are displayed at the bottom of the selected window.
How to display tablesEach window can display only one table at a time. Click Hide Table to turn OFF the table. |
|
Using front-panel |
Using Menus |
|
|
|
|
List of tables
Marker Table
You can display a table of marker settings. These settings include the:
Marker number
Marker reference (for delta measurements)
Frequency
Time and Distance (for Time Domain measurements)
Response
Learn more about Markers
Limit Line Table
You can display, set up, and modify a table of limit test settings. These include:
Type (MIN, MAX, or OFF)
Beginning and ending stimulus values
Beginning and ending response values
Learn more about Limit Lines.
Segment Sweep Table
You can display, set up, and modify a table of segment sweep settings. These include:
State (On/Off)
Start and Stop frequencies
Number of Points
IF Bandwidth (if independent levels)
Power Level (if independent levels)
Sweep Time (if independent levels)
Learn more about Segment sweep
How to show and hide Display items |
|
Using front-panel |
Using Menus |
|
|
|
|
List of Display Labels
Window Title
You can create and display a title for each window.
The limit is set by the number of windows that are displayed.
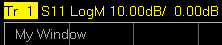
The title (My Window) is annotated in the upper-left of the window as follows:
How to enter a Window Title
Click in the window to make the window active.
Click Response, then Display, then Labels, then Window Title.
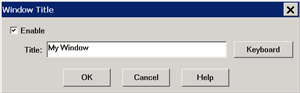
Click Enable, then type the trace title. Click Keyboard to type with a mouse.
To remove the trace title, clear the Enable checkbox, or delete the text from the dialog entry.
Trace Title
A Trace Title overwrites the Measurement Parameter in the Trace Status area, the Status Bar, and hardcopy prints.
This title has priority over Equation Editor titles.
The practical limit is about 70 characters if there is only one trace.
Spaces are accepted but not displayed; use underscores.
The title is annotated as follows:

How to enter a Trace Title
Click the Trace Status label to select a trace.
Click Response, then Display, then Labels, then Trace Title.
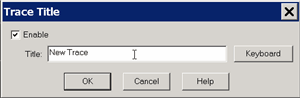
Click Enable, then type the trace title. Click Keyboard to type with a mouse.
To remove the trace title, clear the Enable checkbox, or delete the text from the dialog entry.
Trace Status
|
Trace status is annotated at the top of each window. The highlighted trace number indicates the Active Trace. Click the title to select a trace. |
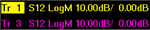
Trace Status shows the following:
Trace number (Tr x). This is the trace number of the channel; NOT the window trace number which is used in many programming commands.
Measurement parameter. This can be replaced with a custom Trace Title (see below).
Format
Scaling factor
Reference level
Frequency/Stimulus


Frequency/stimulus information is displayed at the bottom of each window on the screen. It shows:
Channel number
Start value
Stop value
How to show/hide Frequency/Stimulus information
How to set Grid and Clock display settings |
|
Using front-panel |
Using Menus |
|
|
|
|
Grid: SOLID | Dotted
Set whether to display ALL open window grid lines in solid or dotted lines. The selected setting is shown in CAPS. Once set, new windows are created using this setting. Grid lines return to SOLID when the analyzer is Preset.
Set the color of the grid using Display Colors.
System Date and Time (also known as Clock)
The system date and time can be shown in the far right corner of the status bar.
The format is: year-mo-day hr:min and can NOT be changed.
Learn how to set the time
Minimize Application
The Network Analyzer application can be minimized to show the desktop and Windows taskbar.
Click File
then Minimize Application
To restore the analyzer application, click the analyzer application on the Windows taskbar.
Last modified:
8-Nov-2013 |
Added clock |
21-Jun-2013 |
Removed 3 toolbars (10.0) |
3-May-2012 |
Removed C models |
21-Jul-2011 |
Several changes (9.5) |
16-Mar-2010 |
Added Grid lines (9.2) |
3-Sep-2008 |
Removed legacy content |
27-Aug-2007 |
Edited readout section |
9/12/06 |
Added link to programming commands |
9/27/06 |
MX Added UI |