Generate a report by exporting records to a spreadsheet
From GIS Skills
One of the reasons for selecting a set of parcels is to use the attribute data for those parcels in another application. For example, you might want to send a letter to all the owners of property within a certain distance of a particular parcel. Perhaps construction work is about to begin and the neighboring owners must be notified.
The first thing you need to do is to identify the parcels that are affected. If you have accessed your data through an FDO provider, you can use a buffer zone to quickly select the parcels. (See Select features by location using a buffer.) If your data consists of DWG objects, you can create a buffer zone based on a topology (see AutoCAD Map 3D Help for more information).
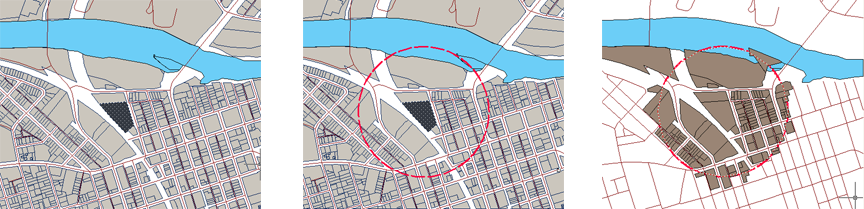
To select the parcels, you use the polygon or circle created by the buffer zone in a location query. The illustration below shows the result of a query that selects parcels within, or crossed by, the buffer zone.
Once you have isolated the parcels in this way, it is very easy to export them from the Data Table. The records are exported in CSV (comma-separated values) format. CSV is a data format for tables that consists of fields separated by the comma character and records separated by newline characters. Any commonly used spreadsheet program, such as Microsoft Excel, will read this format.