


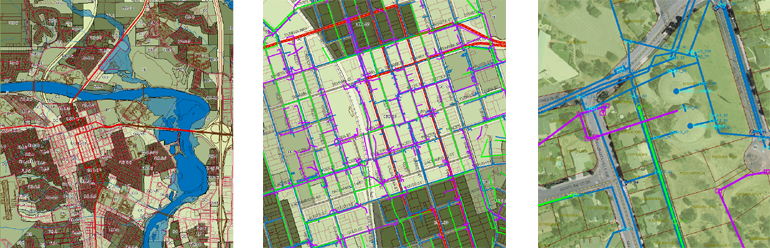
One of the advantages of digital maps over paper maps is that features can appear and disappear as you zoom in and out. Details that would clutter the map when it is zoomed out to its full extent can be hidden and only displayed when the map is zoomed in. Here is an example
- View on the left, showing most of the city—no water pipes, storm drains, or sewer pipes are visible (scale = 1:20,000).
- View in the center, showing a neighborhood in the city—pipes appear as blue, purple, and green lines (scale = 1:5,000).
- View on the right, showing just a few parcels—symbols appear for hydrants, manholes, tanks, and valves. Aerial photo background appears. (scale = 1:1,500)
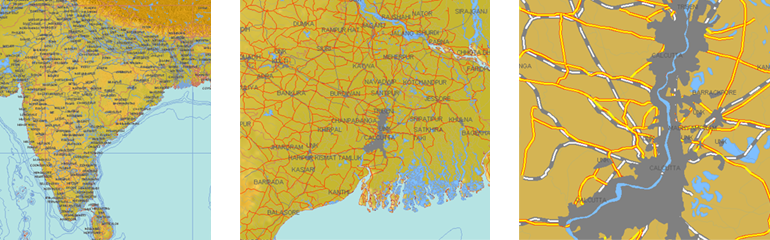
Or the features can change their appearance as the scale changes. Here is an example.
- View on the left, showing the entire country—no roads are visible (scale = 1:10,000,000).
- View in the center, showing a district—roads appear as red lines (scale = 1:1,000,000).
- View on the right, showing a city—roads appear as thick yellow lines with red edges (scale = 1:100,000)
In AutoCAD Map 3D, the mechanism for showing and hiding, or restyling, features at different scales is called a scale range. To use scale ranges effectively, you need to get a sense for the different scales at which it becomes useful to turn features on and off. It usually makes sense to display city infrastructure, such as pipes and cables, at scales of between 1:5,000 to 1:10,000. Individual objects, such as hydrants or traffic signals, can appear at a still larger scale, maybe 1:1000 or 1:2,000.
Of course, you can also decide to show or hide labels for the features at different scales. You can make the labels as well as the symbols that represent the features a different size to show that one feature is bigger than another. (See Label features and optimize placement) A common example is to represent large cities with large circles and smaller cities with smaller ones. (See Replace points in the map with symbols.)
By default, all layers have a single scale range, with a lower bound of 0 and an upper bound of Infinity, which means that the layer is always visible. The first demonstration shows how to change the default scale range for a parcels layer so that the parcels only appear at scales from 0 to 1:20,000.
Show me how to make a layer visible only at a certain scale range
You can add as many scale ranges as you like, to control the appearance of the layer at different scales. You might want to add symbols for points such as hydrants on a map of a city’s water system, and display these symbols when the map is zoomed in. Or you can create composite lines for features such as roads to show detail such as multiple lanes.