


Labels are the names that mark each feature on the map, for example the parcel numbers or the street names on a city map. All feature classes, such as parcels or roads, have a data table that contains properties, stored as columns in the table. Typical properties are the ID and the number in the case of parcels, or size and material in the case of water pipes. There may be many other property columns in the data table as well, which can also appear in the label. Generating labels for features is simply a matter of selecting the property or properties you want to use.
AutoCAD Map 3D centers the label on the feature. It uses a method called dynamic labeling, which means that the placement of the labels is optimized so that labels on the same layer do not overlay one another.
You will also want to consider the size of the labels relative to the features. There are two ways to manage this:
- Create a series of scale ranges with larger labels for closer zoom levels (larger scales).
- Specify that you want the labels to change size automatically as you zoom in and out.
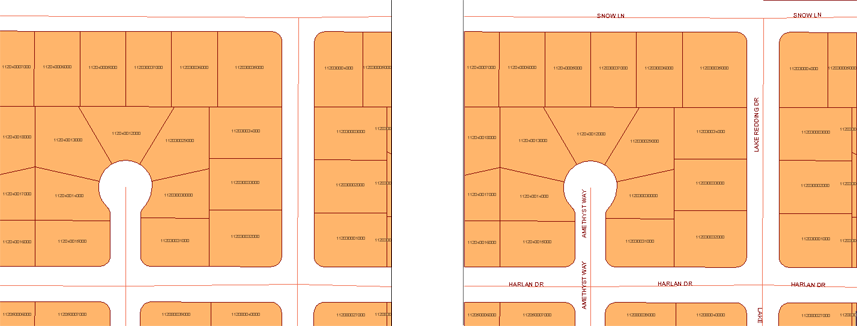
The first method takes a little time and experimentation to set up, but gives you greater control over the size and placement of the labels. The second method can be convenient as it takes almost no time to set up. It also gives good results. The map on the left below shows the labels before zooming. The map on the right shows how the labels get bigger and rearrange themselves after zooming.
If you want to do advanced cartography for printed maps, you will probably want to create your feature labels manually, using standard AutoCAD text tools. You can then place the labels precisely, so that the map is easy to read.

The first demonstration show how to label parcels with their parcel numbers. This animation shows the basic process for labeling any features. It applies equally well to line features (such as roads or rivers) and point features (such as cities or manholes).
The second demonstration labels cities with their names. It is similar to the first procedure, but adds a step to specify automatic resizing for the labels.