Replace points in the map with symbols
From GIS Skills
When you are drafting with AutoCAD, it is common to use a block to represent an object that repeats multiple times. You are probably already familiar with using blocks to show objects such as manholes or utility poles. In GIS terminology, a block used in this way is called a symbol.
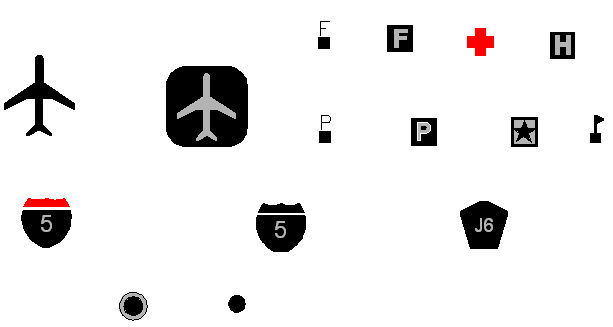
In AutoCAD Map 3D, you can attach symbols to the current map from a symbol library, which is essentially a drawing with blocks in it. Here is an example of a symbol library, showing some symbols which are commonly used in maps in the USA.
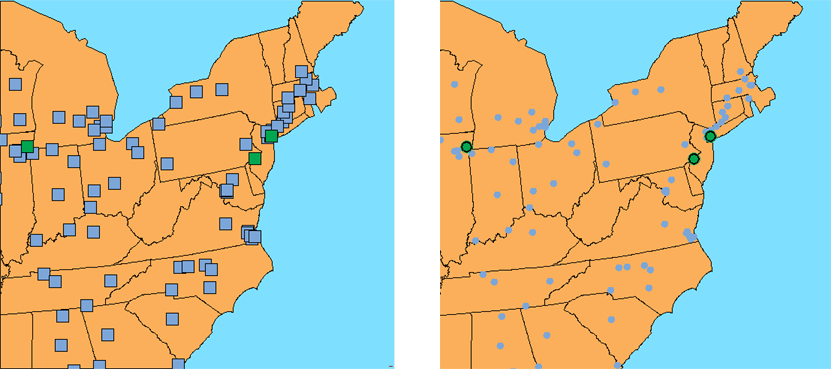
In AutoCAD Map 3D, the default symbol for a point is a square like the ones on the left in the illustration below. The map on the right shows the result of replacing the default symbol with circles of different sizes. The map in this illustration has two point layers: one for cities with a population of over one million (green), and the other for cities with a population of over 100,000 (blue). In this case, our city data table contained an attribute/property for population. It was therefore possible to create separate layers for cities of different population ranges using simple property queries (see Bring in a subset of features using a query).