

combit List & Label
Using Series to Determine the Values
With three-axis diagrams, you can also determine the values of the series axis (y-axis) by means of rows. This means that you define the different rows (e.g. measured value/target value/actual value) with a single data record and can show them parallel e.g. in a bar chart.
As an example, we will create a diagram which shows the currency percentages of the 3 economic areas. Data for APAC, EMEA and NAFTA is supplied as rows.
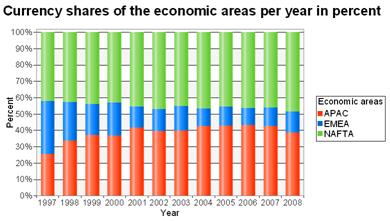
Figure 6.15: Example of a diagram using rows
Proceed as follows in the List & Label Sample Application:
1. Select the "Sales" table as the data source.
2. Choose Bar/Ribbon > 100% stacked as the diagram type.
3. First specify the coordinate values for the category axis, i.e. the values of the x-axis. Select the "Sales.Year" field with the formula wizard. Remove the 2 decimal places using the "Str$(Sales.Year,0,0)" formula.
4. Now specify the coordinate values for the series axis, i.e. the values of the y-axis. Select the "Use rows as data source" entry from the drop-down list above the properties.
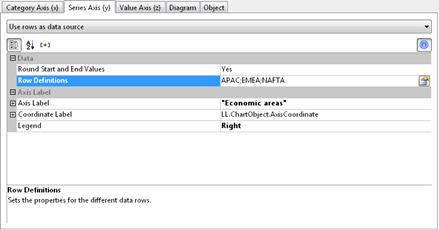
Figure 6.16: Option for using rows to determine the value
This option changes the properties of the series axis and displays a dialog for defining the rows when you click the "Row Definitions" property. Create the individual rows choosing "Sales.APAC", "Sales.EMEA" or "Sales.NAFTA" in each case as the coordinate value.
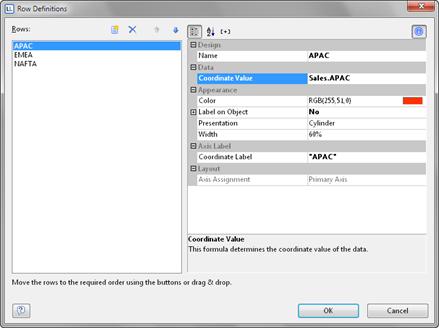
Figure 6.17: Row definitions dialog