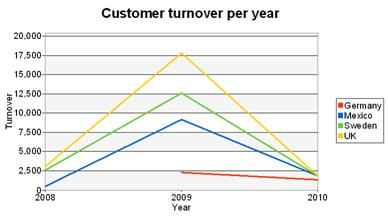
A line diagram offers an alternative to a multi-row bar chart. You can read off the values faster here.

Figure 6.14: Multi-row line chart
Proceed as follows in the List & Label Sample Application:
1. As the data source, select the "Customers > Orders > Order_Details" table.
2. Choose Line/Symbol > Multi-Row as the diagram type.
3. First specify the coordinate values for the category axis, i.e. the values of the x-axis. In the Sample Application, the order year is not supplied directly as a field so you must calculate it using the "Year$(Orders.OrderDate" formula.
4. Now specify the coordinate values for the series axis, i.e. the values of the y-axis. Select the "Customers.Country" field via the formula wizard.
5. Specify the coordinate values for the value axis (z-axis), i.e. calculate the turnover with the "Order_Details.Quantity * Order_Details.UnitPrice" formula.

