

combit List & Label
Defining Groupings
In the wizard's first dialog, or alternatively on the "Axis Definition" tab, you first define the grouping for the rows and columns, i.e. the characteristics.
1. In the "Rows" pane, click on the "Insert a row grouping" button.
2. In the formula wizard, you now enter the field or the expression for the row grouping e.g. Customers.Country. You have now created a row grouping and the data will be grouped by this characteristic.
3. In the "Columns" pane, click on the "Insert a column grouping" button.
4. In the formula wizard, you now enter the field or the expression for the column grouping.
5. Since you first want to group the data by year, you must enter an expression here that returns the year of the order date. You have the Year() function in the formula wizard at your disposal; i.e. you select this function from the list and insert the order date as the parameter by double-clicking. The formula looks like this: Year(Orders.OrderDate).
6. Since we also want to examine the data at another level, insert an additional column grouping via the "Insert a column grouping" button.
7. Now enter an expression to return the quarter of the order date. You can use the Quarter() function in the formula wizard for this. The formula then looks like this: Quarter(Orders.OrderDate).
Note: You can change the order of the groupings with the arrow button. The column at the bottom is the inner grouping.
To swap lines and rows (Pivot function) use the button on the lower right on the "Axis Definition" tab. This button is only available in the object dialog, not in the wizard.
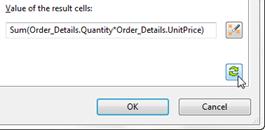
Figure 6.25:Swap all rows and lines
8. You have now created the groupings and you can go on to define the value for the intersection of the respective columns and rows. Click on the "Edit group result formula" button located under "Value of the result cells".
9. Now select the aggregate function that you want for the contents in the "Cell Contents" dialog that appears. You want to create a sales evaluation so choose the "Sum" function. In the upper part of the dialog, you can specify the contents by clicking the formula button to start the formula wizard.
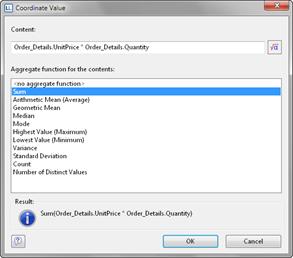
Figure 6.26: Formula wizard for defining the cell content
10. In the Sample Application, the sales per order value is not supplied directly as a field so you must calculate it using the "Order_Details.Quantity * Order_Details.UnitPrice" formula.
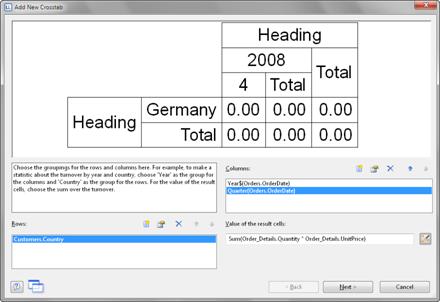
Figure 6.27: Definition of the axes of a three-dimensional crosstab