

combit List & Label
Creating a Crosstab
Crosstabs are used for evaluating and presenting data in multiple dimensions. Crosstabs (or contingency tables) are tables containing information about the frequency of the occurrence of combinations of certain characteristics.
These frequencies are extended by their marginal totals which form "contingencies." With a three-dimensional crosstab, (three characteristics), the table includes an additional column grouping.
For example, you can examine turnover trends per year and region, evaluating sales according to quantities and customers, and create marginal totals for quarters and years.
A normal ("flat") table has the attribute names in the first row and the occurrences of these attributes in all other rows. A crosstab is different. The titles of both columns and rows receive characteristic occurrences and, at the point of intersection of the respective column and row, a value is shown that depends on the characteristics specified for the column and row in each case.
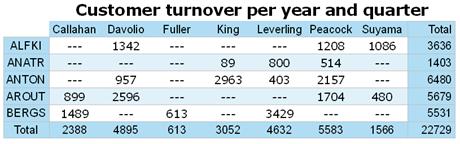
Figure 6.24: Example of a three-dimensional crosstab
For the schematic presentation of two-dimensional crosstabs, the 3D multi-row bar chart is the best choice. You can find more information about this in chapter Creating Charts.
See also:
 The Layout Option and Wrapping Behavior