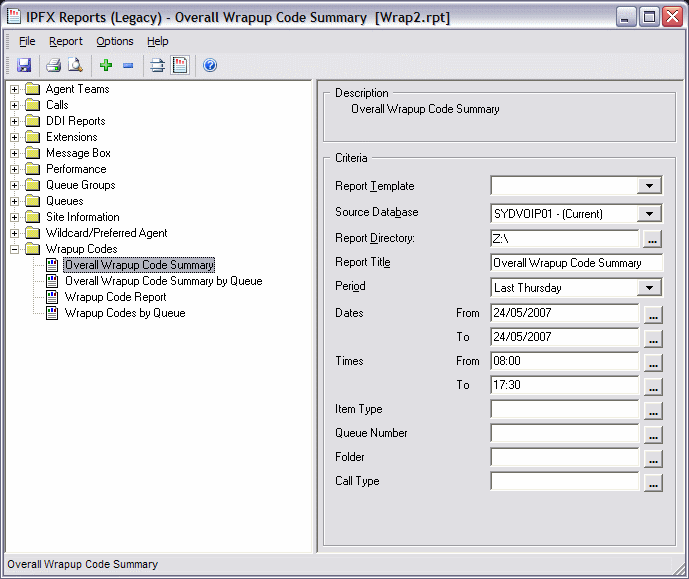
Overall Wrap-up Code Summary
This report identifies how many wrap-up codes were applied to each category over a period of your choice; with a pie chart to show relative usage. The Graph represents talk time by wrap up code. Run this report to find out how many callers were interested in 'Product X" and how many in "Product Y"; and the average talk time for each category.
Report Criteria

Calculations
Report Heading |
Definition |
WrapUp Code |
|
WrapUp Folder |
|
Count |
|
Time In Queue Average |
|
Time Talking Total |
|
Time Talking Total % |
|
Time Talking Average |
|
Time In WrapUp Total |
|
Time In WrapUp Total % |
|